
Where Are America's Real Arts Capitals?
Big coastal cities might have iconic, profitable, and well-funded scenes. But the economic impact of the cultural sector can be larger in some surprising places.

The first by the U.S. Bureau of Economic Analysis provides data on the contributions of arts and cultural employment to the U.S. economy and tracks the geographic distribution of arts and cultural employment across metros.
The data is based on arts and culture employment measured by BEA’s Arts and Cultural Production Satellite Account (ACPSA). The account produces statistics for “core” arts and cultural activities such as performers, musicians, writers, artists, designers. Also included are managers, agents, and promoters, plus museums, art galleries, historical sites, and nature parks. Supporting industries such as broadcasters, grant makers, and musical instrument repairers also make the cut.
Across the nation, arts and culture industries employed roughly 1 million Americans in 2014. That’s less than 1 percent of all workers. Performing arts and design services accounted for about three-quarters of employment in core arts and cultural production industries. It’s the creation of new work from related industries that makes the arts such a key way to generate economic growth. Take dance, for example: Dancers are core arts employees, but they also generate the need for workers who make ballet slippers, build theaters and rehearsal studios, or print programs are employed in related support industries.
All that related work adds up. Arts and cultural economic activity accounted for 4.2 percent of U.S. gross domestic product (GDP), or $729.6 billion in 2014, the latest date for which data is available according to the BEA, growing by roughly 2 percent annually.
The map below charts the picture across the fifty states, using location quotients or LQs to show the concentration of state employment in arts and culture relative to the national average. An LQ of 1 means a state is equal to the national average, while an LQ of 1.5 means it is 50 percent higher, of 2 means it is double and so on. Dark blue on the map indicates states with higher LQs.
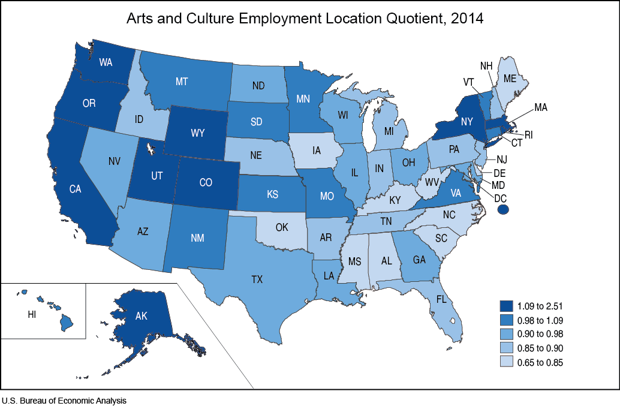
The District of Columbia tops the list with an LQ of 2.5. But D.C. is more comparable to a metro than to other states. New York (1.47) is second, thanks to its large concentration of arts and culture in New York City. The surprises come in the next few states. Coming in at third is Wyoming, with an LQ of 1.3, followed by Washington (1.28), California and Utah (both 1.17), Rhode Island and Colorado (1.13), Alaska (1.11), Massachusetts and Oregon (both 1.09). Note the large span of dark blue signaling states with arts and cultural employment LQs of 1.09 to 2.51 out West. Part of the outsized role of arts and culture jobs in the West has to do with government programs within American Indian tribal councils. Wyoming’s vast parklands also boosts its ranking over Utah and Colorado.
Now check out the next map, which charts the growth in arts and cultural employment by state.
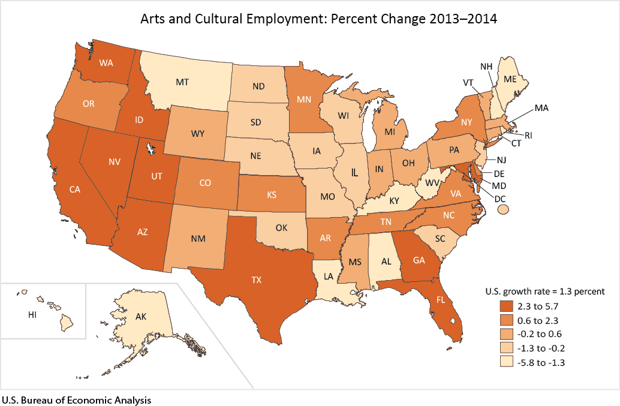
Almost half of all states, 24 of them, saw growth in arts and cultural employment. There are some surprises here. Note the red showing higher rates of growth out West and in parts of the South. Washington led all states with 5.7 percent growth, followed by Arizona (4.4 percent), Utah (4.0 percent), Nevada (3.9 percent), and Florida (3.3 percent). Texas, California, Idaho, Georgia, Florida, and Maryland also saw relatively high rates of growth.
***
Another recent report from the National Center for Arts Research measures an Arts Vibrancy Index. It calculates the number of nonprofit arts and cultural organizations, their revenue earnings, and government support per capita in a metropolitan and micropolitan statistical areas (and metro divisions) in 2015.
The report also tracks the diversity across 11 arts and cultural sectors, including arts education, art museums, community, dance, music, opera, performing arts center, symphony orchestra, theater, other museum, and multidisciplinary performing arts.
The report also tracks the diversity across 11 arts and cultural sectors, including arts education, art museums, community, dance, music, opera, performing arts center, symphony orchestra, theater, other museum, and multidisciplinary performing arts.
Below is an accompanying interactive county heat map of the Arts Vibrancy Index, which scores those component parts from 0 to 100—reflecting from red to green what percentile a county is for its level of artistic engagement.
Large metros: Much is made of the cultural power of New York City and Los Angeles, the bicoastal poles for the nation’s literary, media, and entertainment industries. But—surprise—it’s Washington, D.C., that tops the list of large metros. New York is second, followed by San Francisco, Nashville, Minneapolis-St. Paul, Boston, and then Los Angeles. Silver Spring and Rockville (both D.C. suburbs), Newark, and Seattle round out the top ten for metro divisions with more than one million people. Filling in spots 10 to 20 are Philadelphia, Cambridge, Portland, Denver, Chicago, Pittsburgh, Austin, New Orleans, Rochester, and Richmond.
| Metro Area | Arts Rank | Arts Providers Rank | Arts Dollar Rank | Govt. Support Rank |
| Washington, D.C. | 1 | 13 | 1 | 19 |
| New York, New York | 2 | 1 | 10 | 9 |
| San Francisco, California | 3 | 4 | 5 | 18 |
| Nashville, Tennessee | 4 | 8 | 39 | 47 |
| Minneapolis, Minnesota | 5 | 19 | 8 | 6 |
| Boston, Massachusetts | 6 | 22 | 6 | 15 |
| Los Angeles, California | 7 | 2 | 62 | 300 |
| Silver Spring-Frederick-Rockville, Maryland (D.C. Suburbs) | 8 | 34 | 4 | 38 |
| Newark, New Jersey | 9 | 23 | 53 | 33 |
| Seattle, Washington | 10 | 28 | 22 | 129 |
| Philadelphia, Pennsylvania | 11 | 55 | 14 | 25 |
| Cambridge, Massachusetts | 12 | 44 | 19 | 40 |
| Portland, Oregon | 14 | 25 | 68 | 57 |
| Denver, Colorado | 14 | 50 | 20 | 77 |
| Chicago, Illinois | 15 | 61 | 25 | 85 |
| Pittsburgh, Pennsylvania | 16 | 47 | 38 | 98 |
| Austin, Texas | 17 | 31 | 100 | 34 |
| New Orleans, Louisiana | 18 | 79 | 41 | 31 |
| Rochester, New York | 19 | 67 | 57 | 27 |
| Richmond, Virginia | 20 | 52 | 75 | 80 |
Medium-size metros: Pittsfield, Massachusetts tops the list of medium-size metros between 100,000 and 1 million people, followed by; Santa Fe, New Mexico; San Rafael, California; Missoula, Montana. Burlington, Vermont; Bremerton-Silverdale, Washington; Ithaca, New York; Asheville, North Carolina; Barnstable Town, Massachusetts; and Des Moines, Iowa round out the top ten.
| Metro Area | Arts Rank | Arts Providers Rank | Arts Dollar Rank | Govt. Support Rank |
| Pittsfield, Massachusetts | 1 | 9 | 2 | 5 |
| Santa Fe, New Mexico | 2 | 6 | 3 | 7 |
| San Rafael, California | 3 | 7 | 13 | 35 |
| Missoula, Montana | 4 | 15 | 97 | 39 |
| Burlington, Vermont | 5 | 30 | 43 | 28 |
| Bremerton-Silverdale, Washington | 6 | 37 | 28 | 145 |
| Ithaca, New York | 7 | 33 | 93 | 10 |
| Asheville, North Carolina | 8 | 14 | 142 | 170 |
| Barnstable Town, Massachusetts | 9 | 45 | 32 | 183 |
| Des Moines, Iowa | 10 | 82 | 15 | 115 |
Micropolitan areas: The list of smaller areas is dominated by high-amenity places in the mountain West or East Coast. Breckingridge, Colorado takes the top spot, followed by Summit Park, Utah; Bennington, Vermont; Bozeman, Montana; and the artists and creative colony of Hudson, New York along the Hudson River. Greenfield Town, Massachusetts; Oneonta, New York; Juneau, Alaska; Jackson, Wyoming; and Vineyard Haven, Massachusetts round it the top ten.
| Micropolitan Area | Arts Rank | Arts Providers Rank | Arts Dollar Rank | Govt. Support Rank |
| Breckenridge, Colorado | 1 | 3 | 9 | 61 |
| Summit Park, Utah | 2 | 5 | 24 | 3 |
| Bennington, Vermont | 3 | 24 | 7 | 17 |
| Bozeman, Montana | 4 | 10 | 89 | 16 |
| Hudson, New York | 5 | 18 | 72 | 11 |
| Greenfield Town, Massachusetts | 6 | 21 | 56 | 12 |
| Oneonta, New York | 7 | 29 | 23 | 21 |
| Juneau, Alaska | 8 | 57 | 21 | 2 |
| Jackson, Wyoming | 9 | 16 | 94 | 58 |
| Vineyard Haven, Massachusetts | 10 | 35 | 26 | 45 |
Both studies show the increasing importance of the arts to local economies and to local attractiveness and quality of life. And both also put Washington, D.C.,—a place thought more as a joyless playground for policy wonks and politicians that artists and creatives—at the top of their lists.
D.C. admittedly is a bit of an outlier, with its dense abundance of government-funded national museums. But the many other cultural amenities that the modern District provides highlights how people who come to work in other industries produce a related demand for art and culture—with or without actual artists flocking to a particular scene. The message for city leaders elsewhere: You don’t have to be New York or Los Angeles to benefit from the arts. Smaller states and towns can also foster and benefit from being hubs of artistic and creative activity.
Δεν υπάρχουν σχόλια:
Δημοσίευση σχολίου