Global Debt Increase 2018 Vs. Gold Investment: Must See Charts
N
Money Metals Exchange
Global debt increased at the fastest rate at the beginning of 2018. In just one quarter, total global debt jumped by more than $8 trillion. That is quite surprising as total world debt rose by $22 trillion for the full year in 2017. Thus, the increase in global debt last year averaged $5.5 trillion each quarter.
However, global debt according to the Institute of International Finance dropped by $1.5 trillion in the second quarter of 2018. While mature markets saw their debt decline in Q2 2018, emerging market debt increased by $1 trillion led by China. In looking at the data from the Institute of International Finance (NYSE:IIF), they stated that global debt jumped by over $8 trillion in the first quarter of 2018 to $247 trillion, but then declined $1.5 trillion to $247 trillion in Q2 2018.
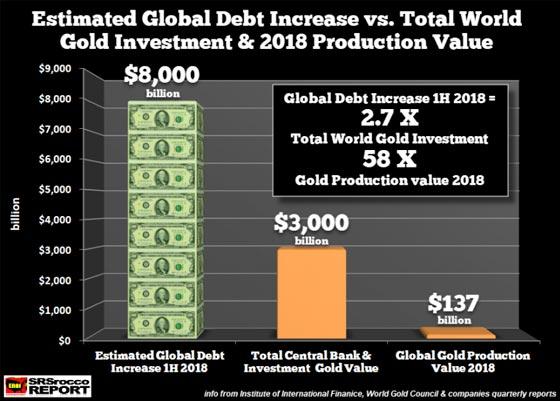
So, the global debt must have jumped by $9.5 trillion to $248.5 trillion during the first quarter of 2018 and then dropped $1.5 trillion in Q2. Thus, the IIF must be revising their figures each quarter. Either way, the net increase in global debt in the first half of 2018 was $8 trillion.
If we look at the following chart below, we can see how the increase in global debt compares to the value of the total global gold investment as well as the value of world gold supply:

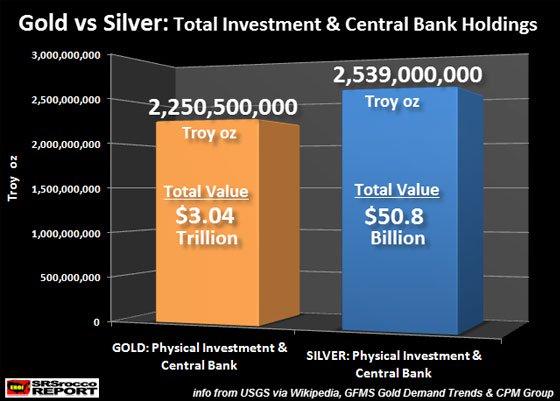
From my research, total world gold investment, Central bank and private investment total approximately $3 trillion. This is based on the data from the next chart that estimates global gold investment of 2.25 billion oz valued at a $3 trillion:

www.fotavgeia.blogspot.com

Δεν υπάρχουν σχόλια:
Δημοσίευση σχολίου