
World Population Growth
by Max Roser and Esteban Ortiz-Ospina[cite]
First published in 2013; updated April, 2017.
200 years ago there were less than one billion humans living on earth. Today, according to UN calculations there are over 7 billion of us.1 Recent estimates suggest that today's population size is roughly equivalent to 6.5% of the total number of people ever born.2This is the most conspicuous fact about world population growth: for thousands of years, the population grew only slowly but in recent centuries, it has jumped dramatically. Between 1900 and 2000, the increase in world population was three times greater than during the entire previous history of humanity—an increase from 1.5 to 6.1 billion in just 100 years.
How the world population is changing is of great importance for humanity’s impact on the Earth’s natural environment, but it also gives reasons to hope for a good future. This is because we have a bigger team of better educated people who can contribute to the solutions that improve global well-being.
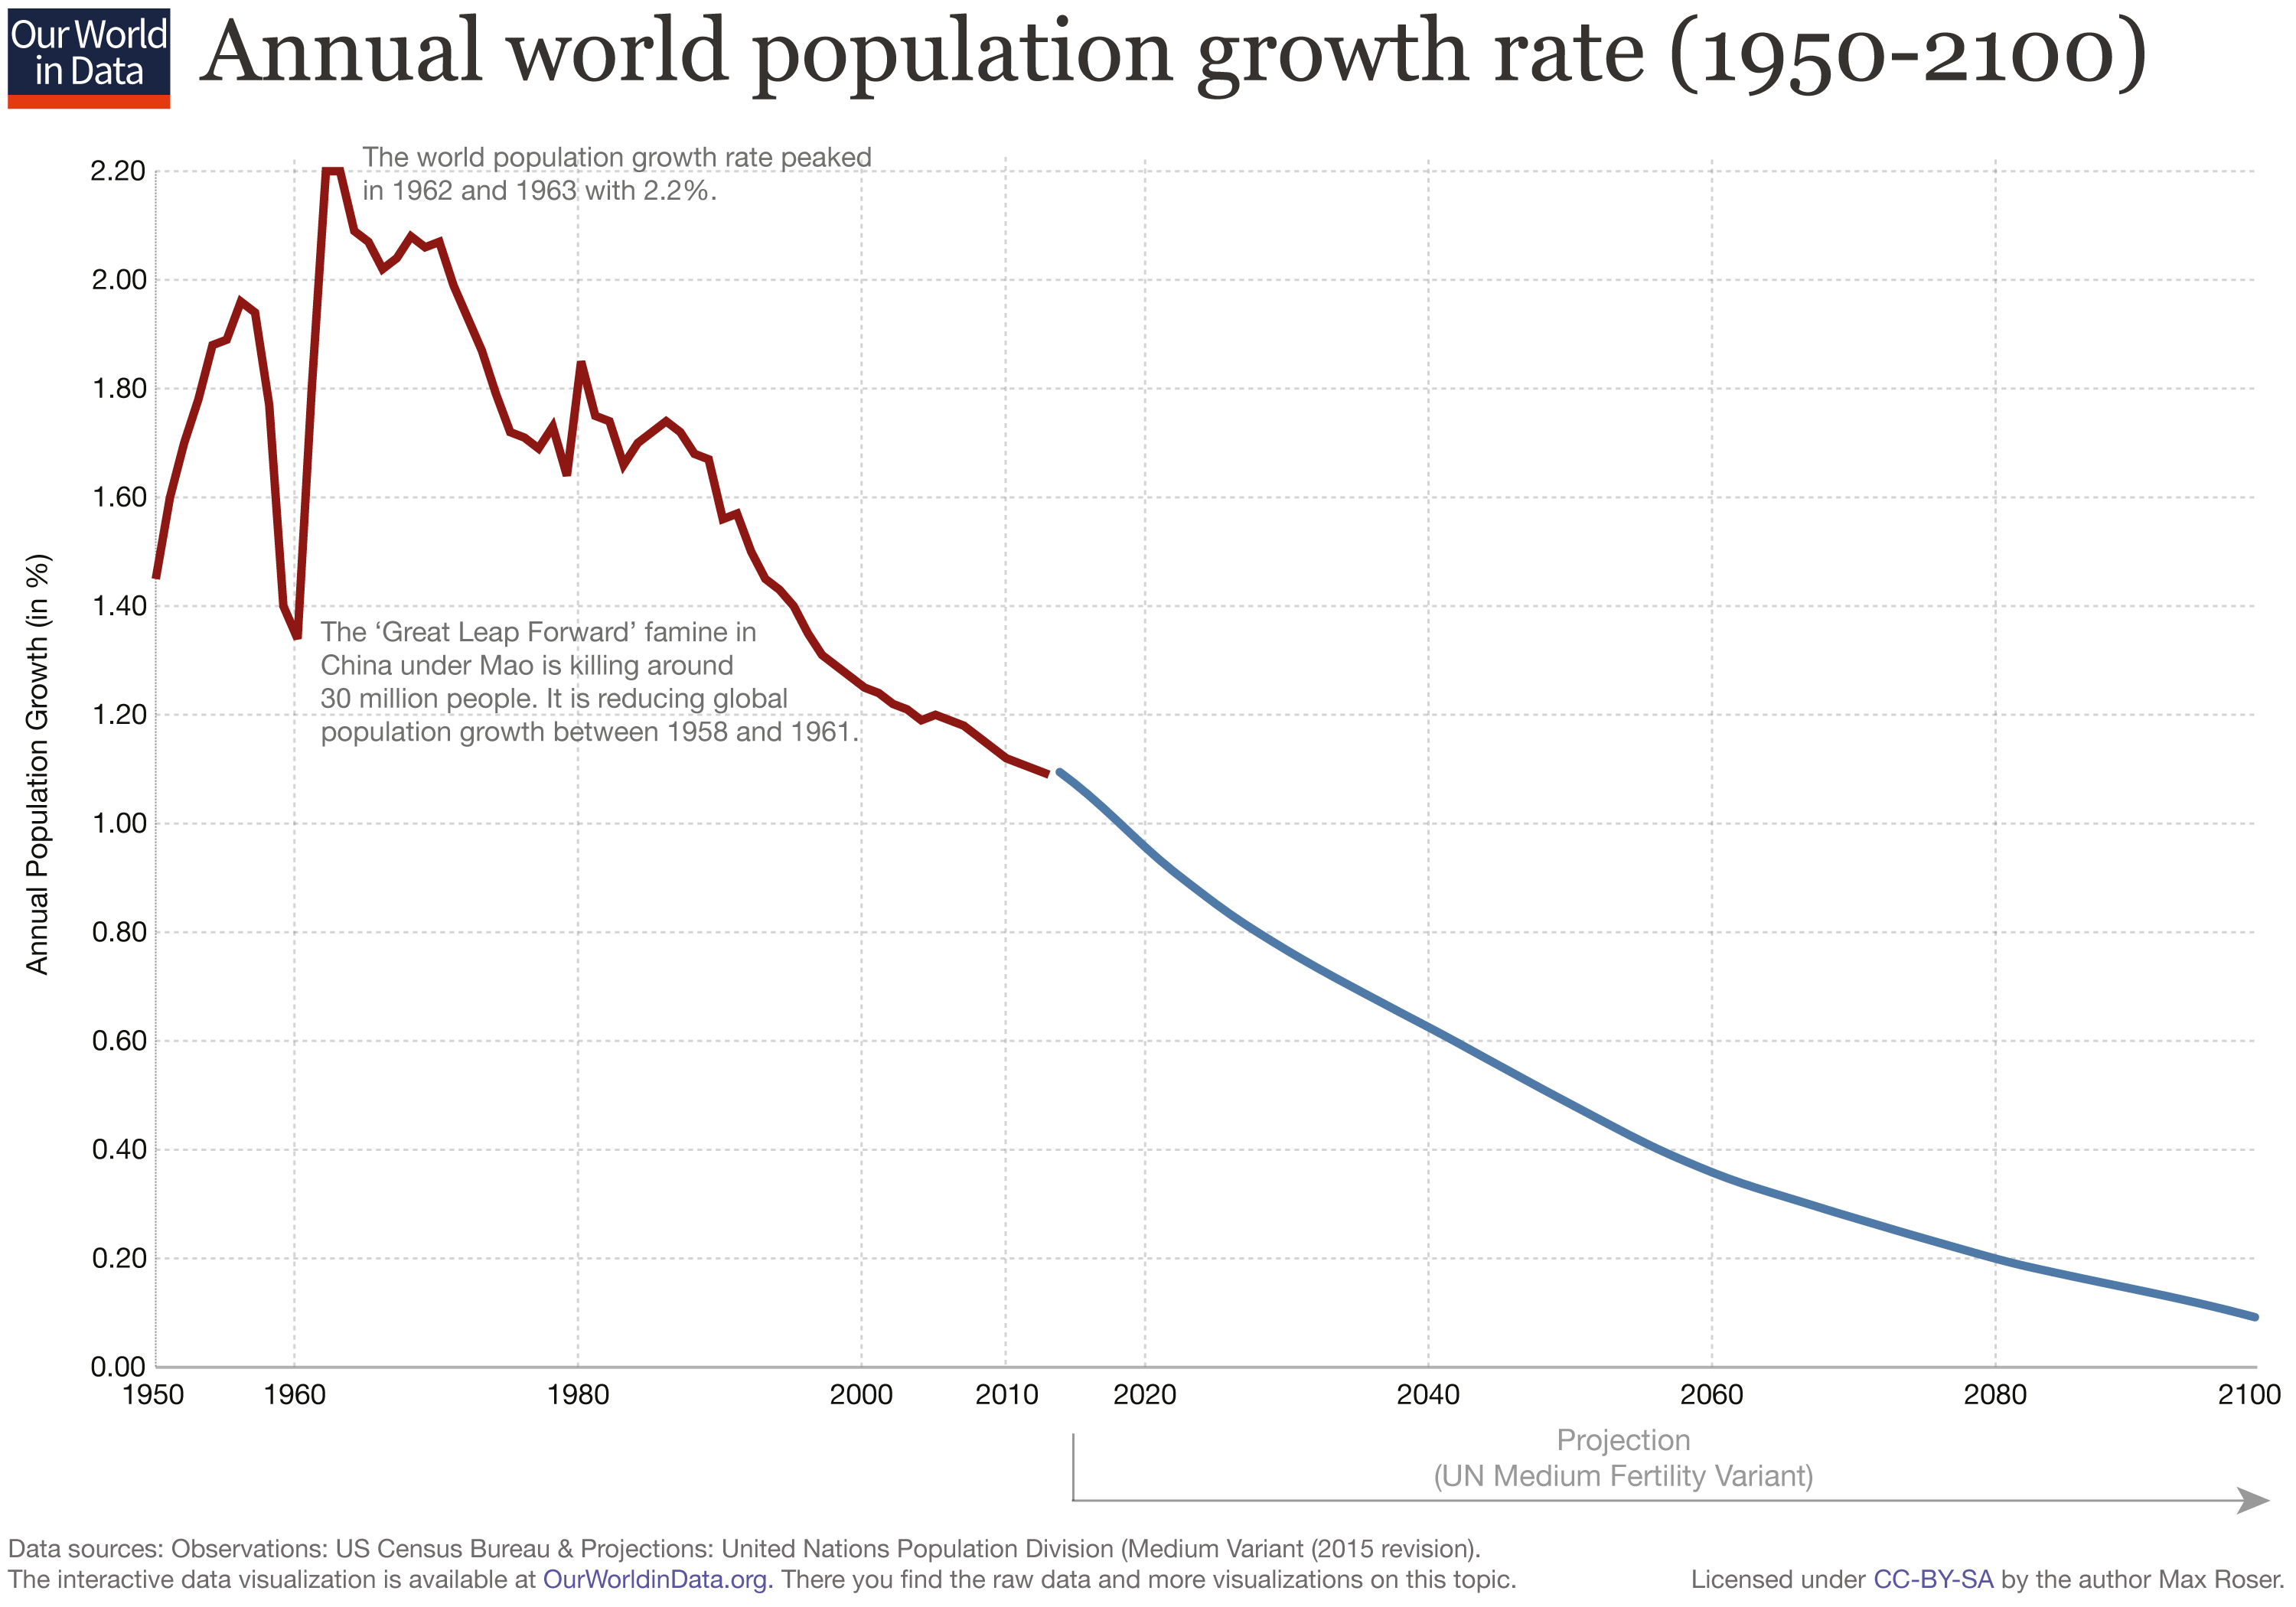
A picture of the world population in the very long-run shows extremely rapid growth. Indeed, for a long time the world population grew at an increasing rate. However, if we focus on the last couple of decades, we see that this pattern no longer holds, as the annual rate of population growth has been recently going down. 1962 saw the growth rate peak at 2.1%, and it has since fallen to almost half. A long historical period of accelerated growth has thus come to an end.
Based on these observations, world history can be divided into three periods marked by distinct trends in population growth. The first period, pre-modernity, was a very long age of very slow population growth. The second period, beginning with the onset of modernity—which was characterized by rising standards of living and improving health—had an increasing growth rate that continued to rise through 1962. Today, the second period is over, and the third period is unfolding; the population growth rate is falling and will likely continue to fall, leading to an end of population growth towards the end of this century.
I. Empirical View
I.1 Population size vs. population growth rate
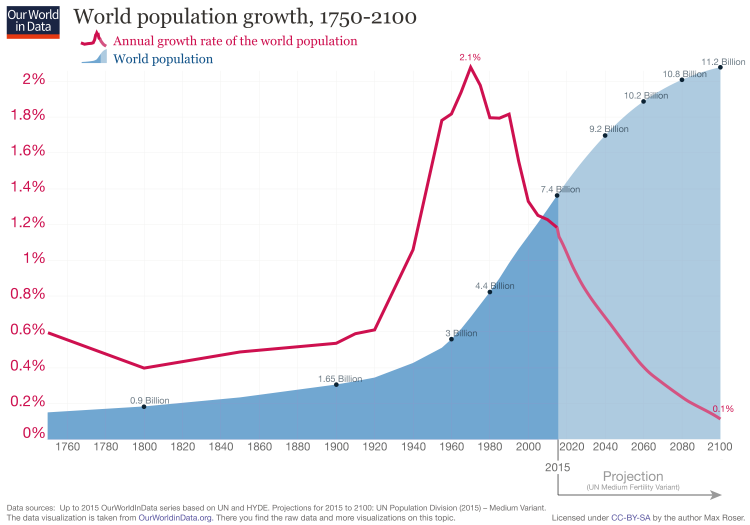
In order to study how the world population changes over time, it is useful to consider the rate of change rather than focusing only on the total population level. The following visualization presents the annual population growth rate superimposed over the total world population for the period 1750-2010, as well as projections up to 2100. This is the period in history when population growth changed most drastically. Before 1800, the world population growth rate was always well below 1%. Over the course of the first fifty years of the 20th century, however, annual growth increased to up to 2.1%—the highest annual growth rate in history, which was recorded in 1962. Since peaking, the growth rate has systematically been going down, with projections estimating an annual rate of 0.1% for 2100.
This means that while the world population quadrupled in the 20th century, it will not double in the 21st century.
World population, 1750-2015 and projections until 21003
I.2 Long-run historical perspective
World Population from 10,000 BCE to 2100 CE
The chart below shows the the increasing number of people living on our planet over the last 12,000 years. A mind boggling change: The world population today that is 1,860-times the size of what it was 12 millennia ago when the world population was around 4 million or half of the current population of London.
What is striking about this chart is of course that almost the entire action happened just very recently. Historical demographers estimate that around the year 1800 the world population was only around 1 billion people. This implies that on average the population grew very slowly over this long time from 10,000 BCE to 1700 (by 0.04% annually).
After 1800 this changed fundamentally: The world population was around 1 billion in the year 1800 and increased 7-fold since then.
Around 108 billion people have ever lived on our planet. This means that today's population size makes up 6.5% of the total number of people ever born.4
The visualization allows you to add the UN's projected population increase through the end of the 21st century as estimated in their Medium Variant (for more detail on the UN's population estimates, see below). Hovering your mouse over the plotted line will show you population figures for each year.
For the long period from the appearance of modern Homo sapiens up to the starting point of this chart in 10,000 BCE it is estimated that the total world population was often well under one million.5 In this period our species was often seriously threatened by extinction.6
World Population over the last 12,000 years and UN projection until 210010000 BCE8000 BCE6000 BCE4000 BCE2000 BCE0210002 billion4 billion6 billion8 billion10 billion LINEAR
Source: World Population over 12000 years - various sources (2016), Medium Projection – UN Population Division (2015 revision)
Download the annual world population data published by Our World in Data
How often does the world population double?
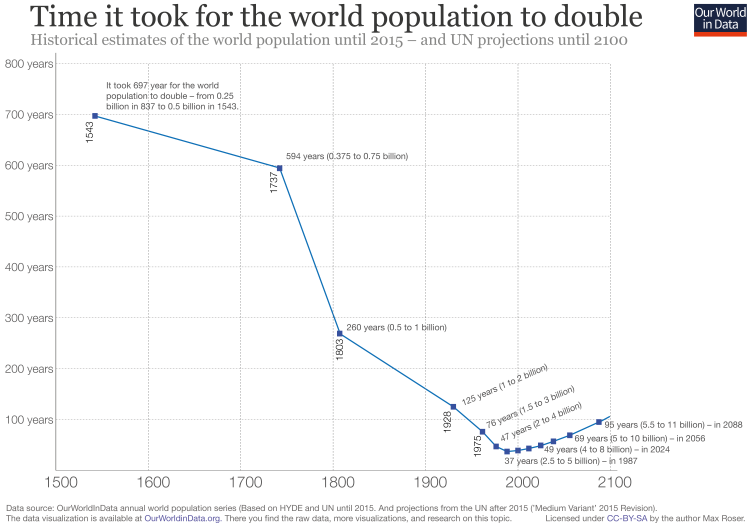
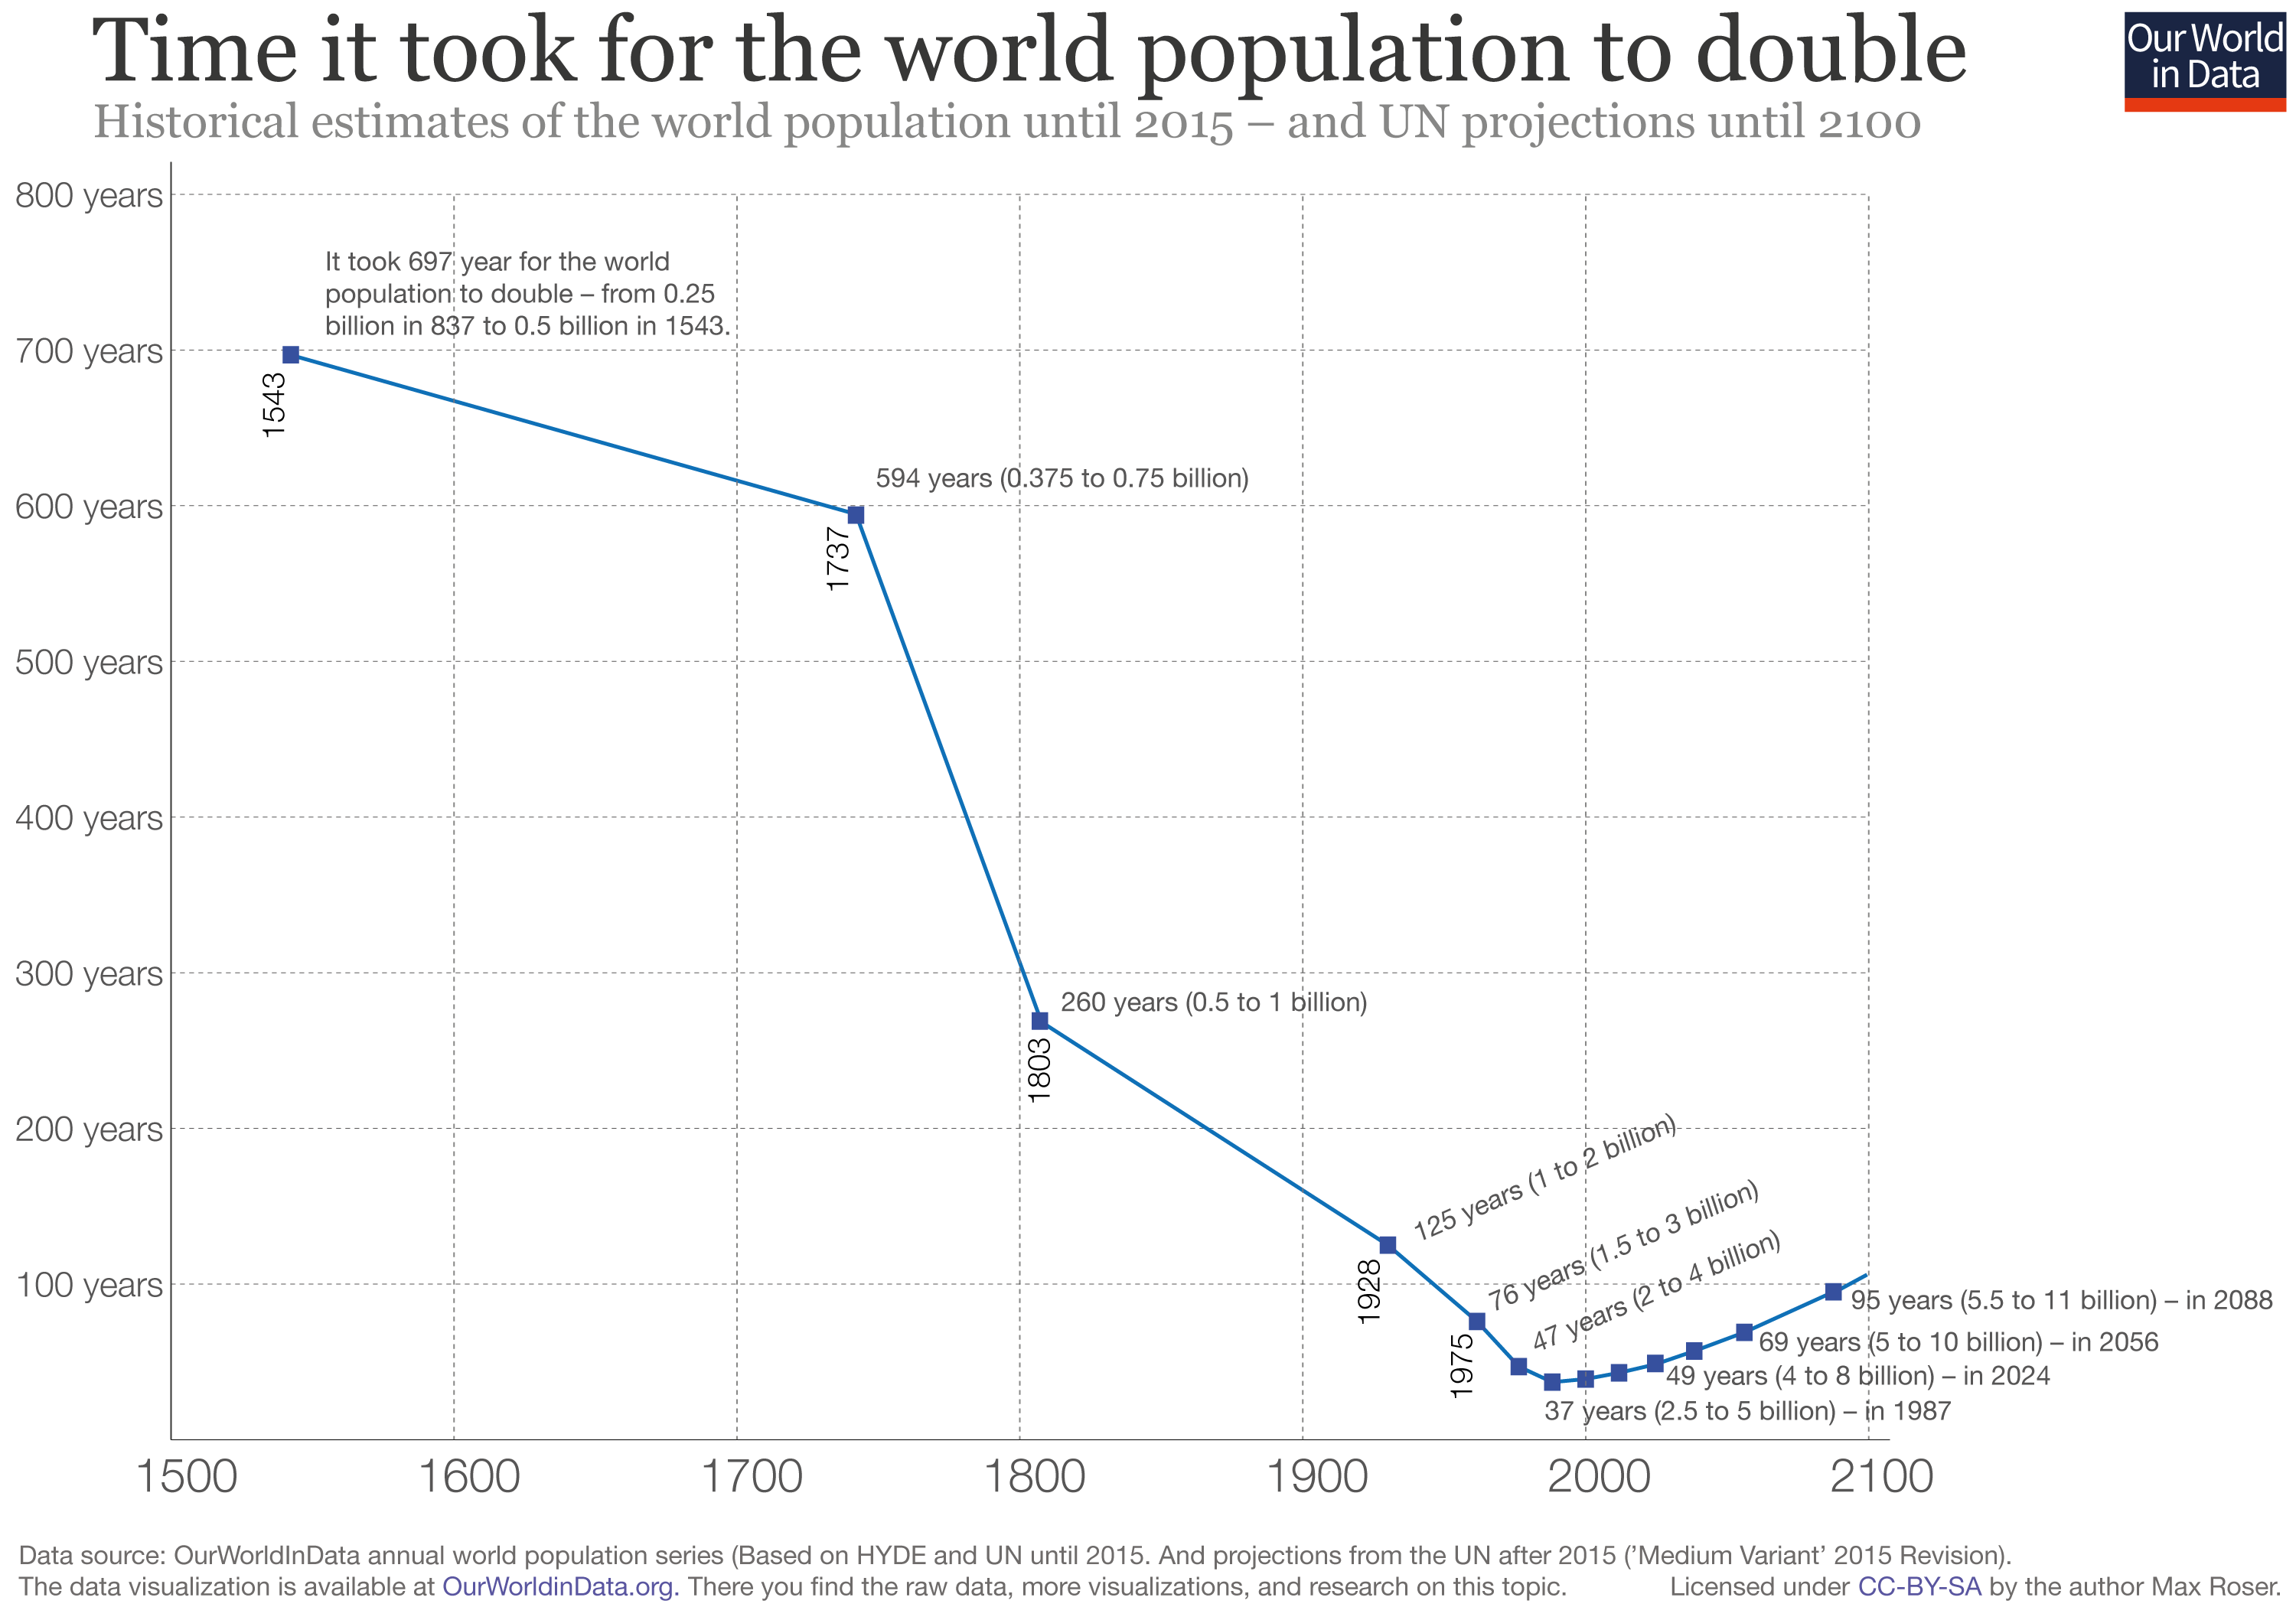
The visualisation below presents a different perspective on the long-term increase of the world population and asks how long it took for the world population to double.
The visualisation shows how strongly the growth rate of the world population changed over time: In the past the population grew slowly: it took nearly seven centuries for the population to double from 0.25 billion (in the early 9th century) to 0.5 billion in the middle of the 16th century. As the growth rate slowly climbed, the population doubling time fell but remained in the order of centuries into the first half of the 20th century. Things sped up considerably in the middle of the 20th century. The fastest doubling of the world population happened between 1950 and 1987: a doubling from 2.5 to 5 billion people in just 37 years — the population doubled within a little more than one generation. This period was marked by a peak population growth of 2.1% in 1962.
Since then, population growth has been slowing, and along with it the doubling time. In this visualisation we have used the UN projections to show how the doubling time is projected to change until the end of this century. By 2088, it will once again have taken nearly 100 years for the population to double to a predicted 11 billion.
Time it took for the world population to double7
Time taken for population to increase by one billion
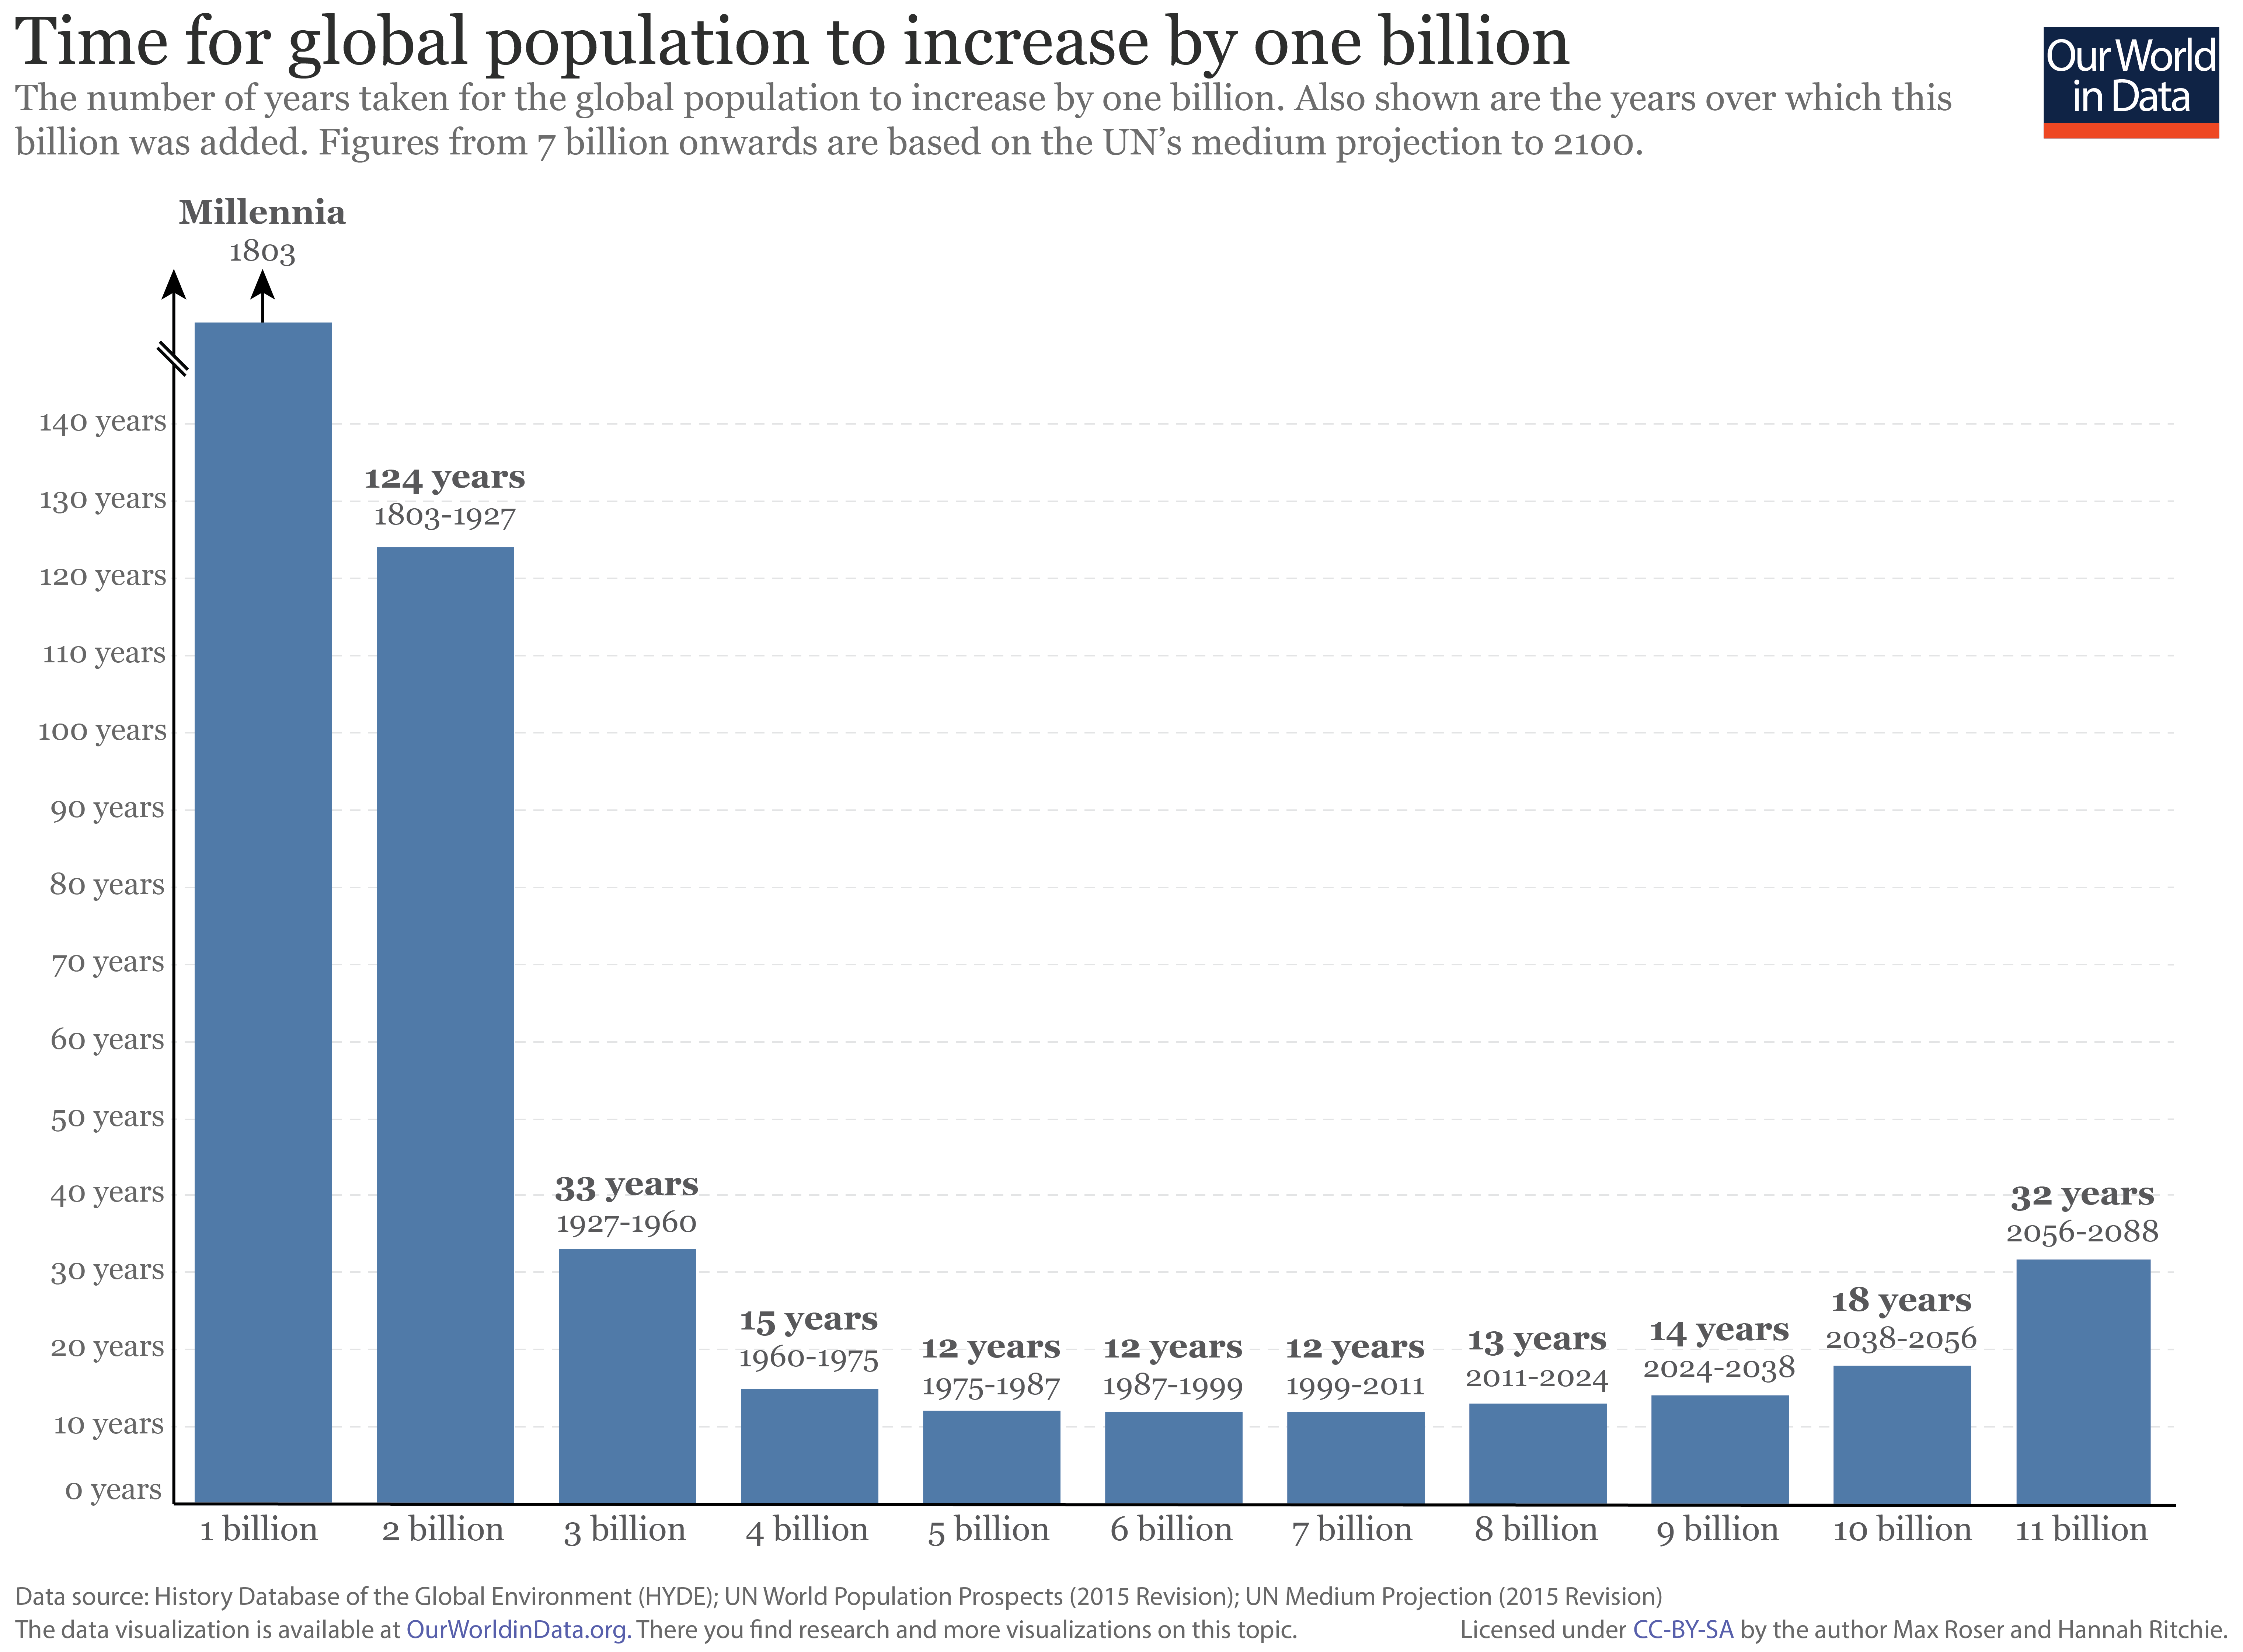
The visualisation below provides an additional perspective on population growth: the number of years it took to add one billion to the global population. Also shown in this figure is the number of years projected up to 11 billion based on the UN's 'medium variant' projection.
This visualisation shows again how the population growth rate has changed dramatically through time. It wasn't until 1803 that the world reached its first billion; it then took another 124 years to reach two billion. By the third billion, this period had reduced to 33 years, reduced further to 15 years to reach four. The period of fastest growth occurred through 1975 to 2011, taking only 12 years to increase by one billion for the 5th, 6th and 7th.
The world has now surpassed this peak rate of growth, and the period between each billion is expected to continue to rise. It's estimated to take approximately 13 years to reach eight billion in 2024; a further 14 years to reach 9 billion in 2038; 18 years to reach 10 billion in 2056; and a further 29 years to reach the 11th billion in 2088.
Time it took for the world population to increase by one billion8

I.3 Country trends over the last centuries
The global pattern masks a great deal of heterogeneity across countries; faster population growth started at different points in time in each country. The following visualization shows total population by country in the last centuries.
The data below shows the latest UN data for the time since 1950 and the estimates published by Gapminder for the period before.
Data from Clio-Infra on the population by country over the last 500 years can be seen in this chart. Substantial differences are evident here: adding the U.S. to the graph reveals that, while the population in France roughly doubled in the period 1800-2000, in this same period the population in the U.S. increased almost 50-fold.
This also meant that the population density increased rapidly in many countries, as can be seen on this interactive visualization.
Population by country17001750180018501900195020160200 million400 million600 million800 million1 billion1.2 billion1.4 billionChinaIndiaUnited StatesBrazilSource: Gapminder until 1949, UN Population Division from 1950-
I.4 Shares by world regions
The estimates provided by the History Database of the Global Environment (HYDE) are shown in the following visualization that provides a break down of the world population by world regions.
Asia is – and has been for a long time – the most populous region in the world.
World population by world regions18201850190019502000201601 billion2 billion3 billion4 billion5 billion6 billion7 billionNorth and CentralAmericaSouth AmericaOceaniaEuropeAsiaAfricaSource: Global Population by Region - HYDE (2016)
I.5 Recent history and projections
In terms of recent developments, the data from the UN Population Division provides consistent and comparable estimates (and projections) within and across countries and time, over the last century. This data starts from estimates for 1950, and is updated periodically to reflect changes in fertility, mortality and international migration (for more information see the Data Quality section at the end of this entry).
The global population growth rate peaked long ago
The chart below shows that global population growth reached a peak in 1962 and 1963 with an annual growth rate of 2.2%; but since then, world population growth was halved.
For the last half-century we have lived in a world in which the population growth rate has been declining. The UN projects that this decline will continue in the coming decades.
The absolute increase of the population per year has peaked in the late 1980s at over 90 million additional people each year and can be seen here.

Natural population growth
'Natural population growth' measures the rate of population increase as determined solely by births and deaths. Migration flows are not taken into account.
The map below illustrates the rate of natural population growth by country from 1955 to 2015 (use the slider underneath the map to change years).
We see that there are some countries today where the natural population growth is slightly negative: the number of deaths exceed the number of births. When we move the time slider underneath the map to past years, we see that this is a new phenomenon. Up until the 1970s, there were no countries with a negative natural population growth.
Worldwide, population growth is slowing—you can press the play arrow at the bottom of the chart to see the change over time.
Natural population growth, 2015Natural population growth is the population increase determined by births and deaths. Migration flows are not takeninto account.No data<-1 .5="" br="" division="" increase="" natural="" of="" ource:="" population="" rate="" un="">
1Population growth by country
The following visualization presents the rate of population growth by country—and here, migration flows are taken into account in addition to the population growth determined by births and deaths. The chart shows data for the period 1955-2015, plus projections for 2015-2100 using the UN Population Division data.
You can toggle the visualization from chart to map view for a wider, cross-country comparison. As you can see, growth rates in most countries have been going down since the 1960s. Yet substantial differences exist across countries and regions. While Western Europe's growth rates are currently close to zero, sub-Saharan Africa's rates remain higher than 3%—that is, still higher than the peak growth rates recorded for the world at the beginning of the 1960s. Moreover, in many cases there has been divergence in growth rates. For instance, while India and Nigeria had similar growth rates in 1960 (around 1.7%), they took very different paths in the following years and thus currently have populations that grow at very different rates (about 1.26% for India compared to 2.67% for Nigeria).
Population growth rate, 2015Average annual rate of population change (including the UN's 'Medium variant' projections until 2100)No data<-6>6%Source: UN Population Division (2017 Revision)
Population growth by the level of development
The following visualization presents how the population growth rate has changed for 'more developed', 'less developed' and 'least developed' countries (UN categorization), and how they are projected to change through 2100 (UN Population Division estimates and projections from the 2015 revision).
Developed countries reached the fastest growth rates longer ago and the population growth rates there have been falling for many decades. The less developed countries' growth rate peaked in the late 1960s and in the least developed countries the population growth rate peaked around 1990.
Over the last two decades we are seeing declining population growth rates in countries at all stages of development.
Population growth rate by world region, 1955-2015 and projections through2100Projections use the UN medium variant195019802000202020402060208020990%0.5%1%1.5%2%2.5%More developed regions - Projectedgrowth rateLess developed regions - Projectedgrowth rateLeast developed countries - Projectedgrowth rateSource: UN Population Division (2017 Revision)Note: More developed regions comprise Europe, Northern America, Australia/New Zealand and Japan; less developed regions comprise all regionsof Africa, Asia (excluding Japan), Latin America and the Caribbean plus Melanesia, Micronesia and Polynesia; least developed countries are 48countries, 33 in Africa, 9 in Asia, 5 in Oceania plus one in Latin America and the Caribbean.
Population density
The above discussion also shows that there are interesting patterns of population density: the most densely populated regions today have also been the most densely populated regions throughout modern history. India is a prime example of this. The following visualization shows population density patterns by country using data from the History Database of the Global Environment (HYDE). Switch to the map view for a global perspective.
Population densityNumber of inhabitants per square kilometer.5000 BCE4000 BCE3000 BCE2000 BCE1000 BCE010002100050100150200 LINEAR
Population projections based on education levels
The International Institute for Applied Systems Analysis (IIASA) is an interdisciplinary, highly-respected research institution near Vienna, Austria. The IIASA population projections are the most cited alternative to the UN work.
Interestingly, their medium projection for population growth (which they consider most likely) stands in stark contrast to the UN projection. While the medium variant of the UN projection sees the world population growing continuously throughout the 21st century, the IIASA medium scenario sees the world population increase to 9.4 billion in 2070, and then begin a slow decline to reach below 9 billion by the end of the century.
As the IIASA researchers explain, there are important methodological differencesbetween the UN and IIASA projections. The UN uses probabilistic population projections to extrapolate populations for each country over the 21st century and applies the same statistical methodology to all countries. In contrast, the IIASA researchers have a country-specific approach that takes into account the knowledge of experts for each country separately.
The other important feature of the IIASA projection is that it takes into account how educated a given population is. As we show below, there is a strong link between education and fertility—more educated women have fewer children. This link is factored into IIASA's model and contributes to their projection of a much smaller total world population over the course of the 21st century.
Breaking down the population by education level is especially interesting: we see that our world will be inhabited by more and more educated people. The visualization below shows that in 1970 there were only around 700 million people in the world who had secondary or post-secondary education. By the end of this century, the number of people with secondary or post-secondary education will have increased 10-fold and will reach 7 billion people (a figure similar to the entire current world population)!
The projection also shows that the number of people with no education will decrease continuously and that by the end of this century virtually all people in the world will have received some level of education.
Projected world population by level of educationThis visualization shows the Medium projection by the International Institute for Applied Systems Analysis (IIASA). Theresearchers who created this projection describe it as their "middle of the road scenario that can also be seen as themost likely path".1970198020002020204020602080210002 billion4 billion6 billion8 billionPost SecondaryUpper SecondaryLower SecondaryPrimaryIncomplete PrimaryNo EducationUnder 15Source: Global Projection, Medium SSP2 - IIASA (2016)
I.6 How will the global demography change?
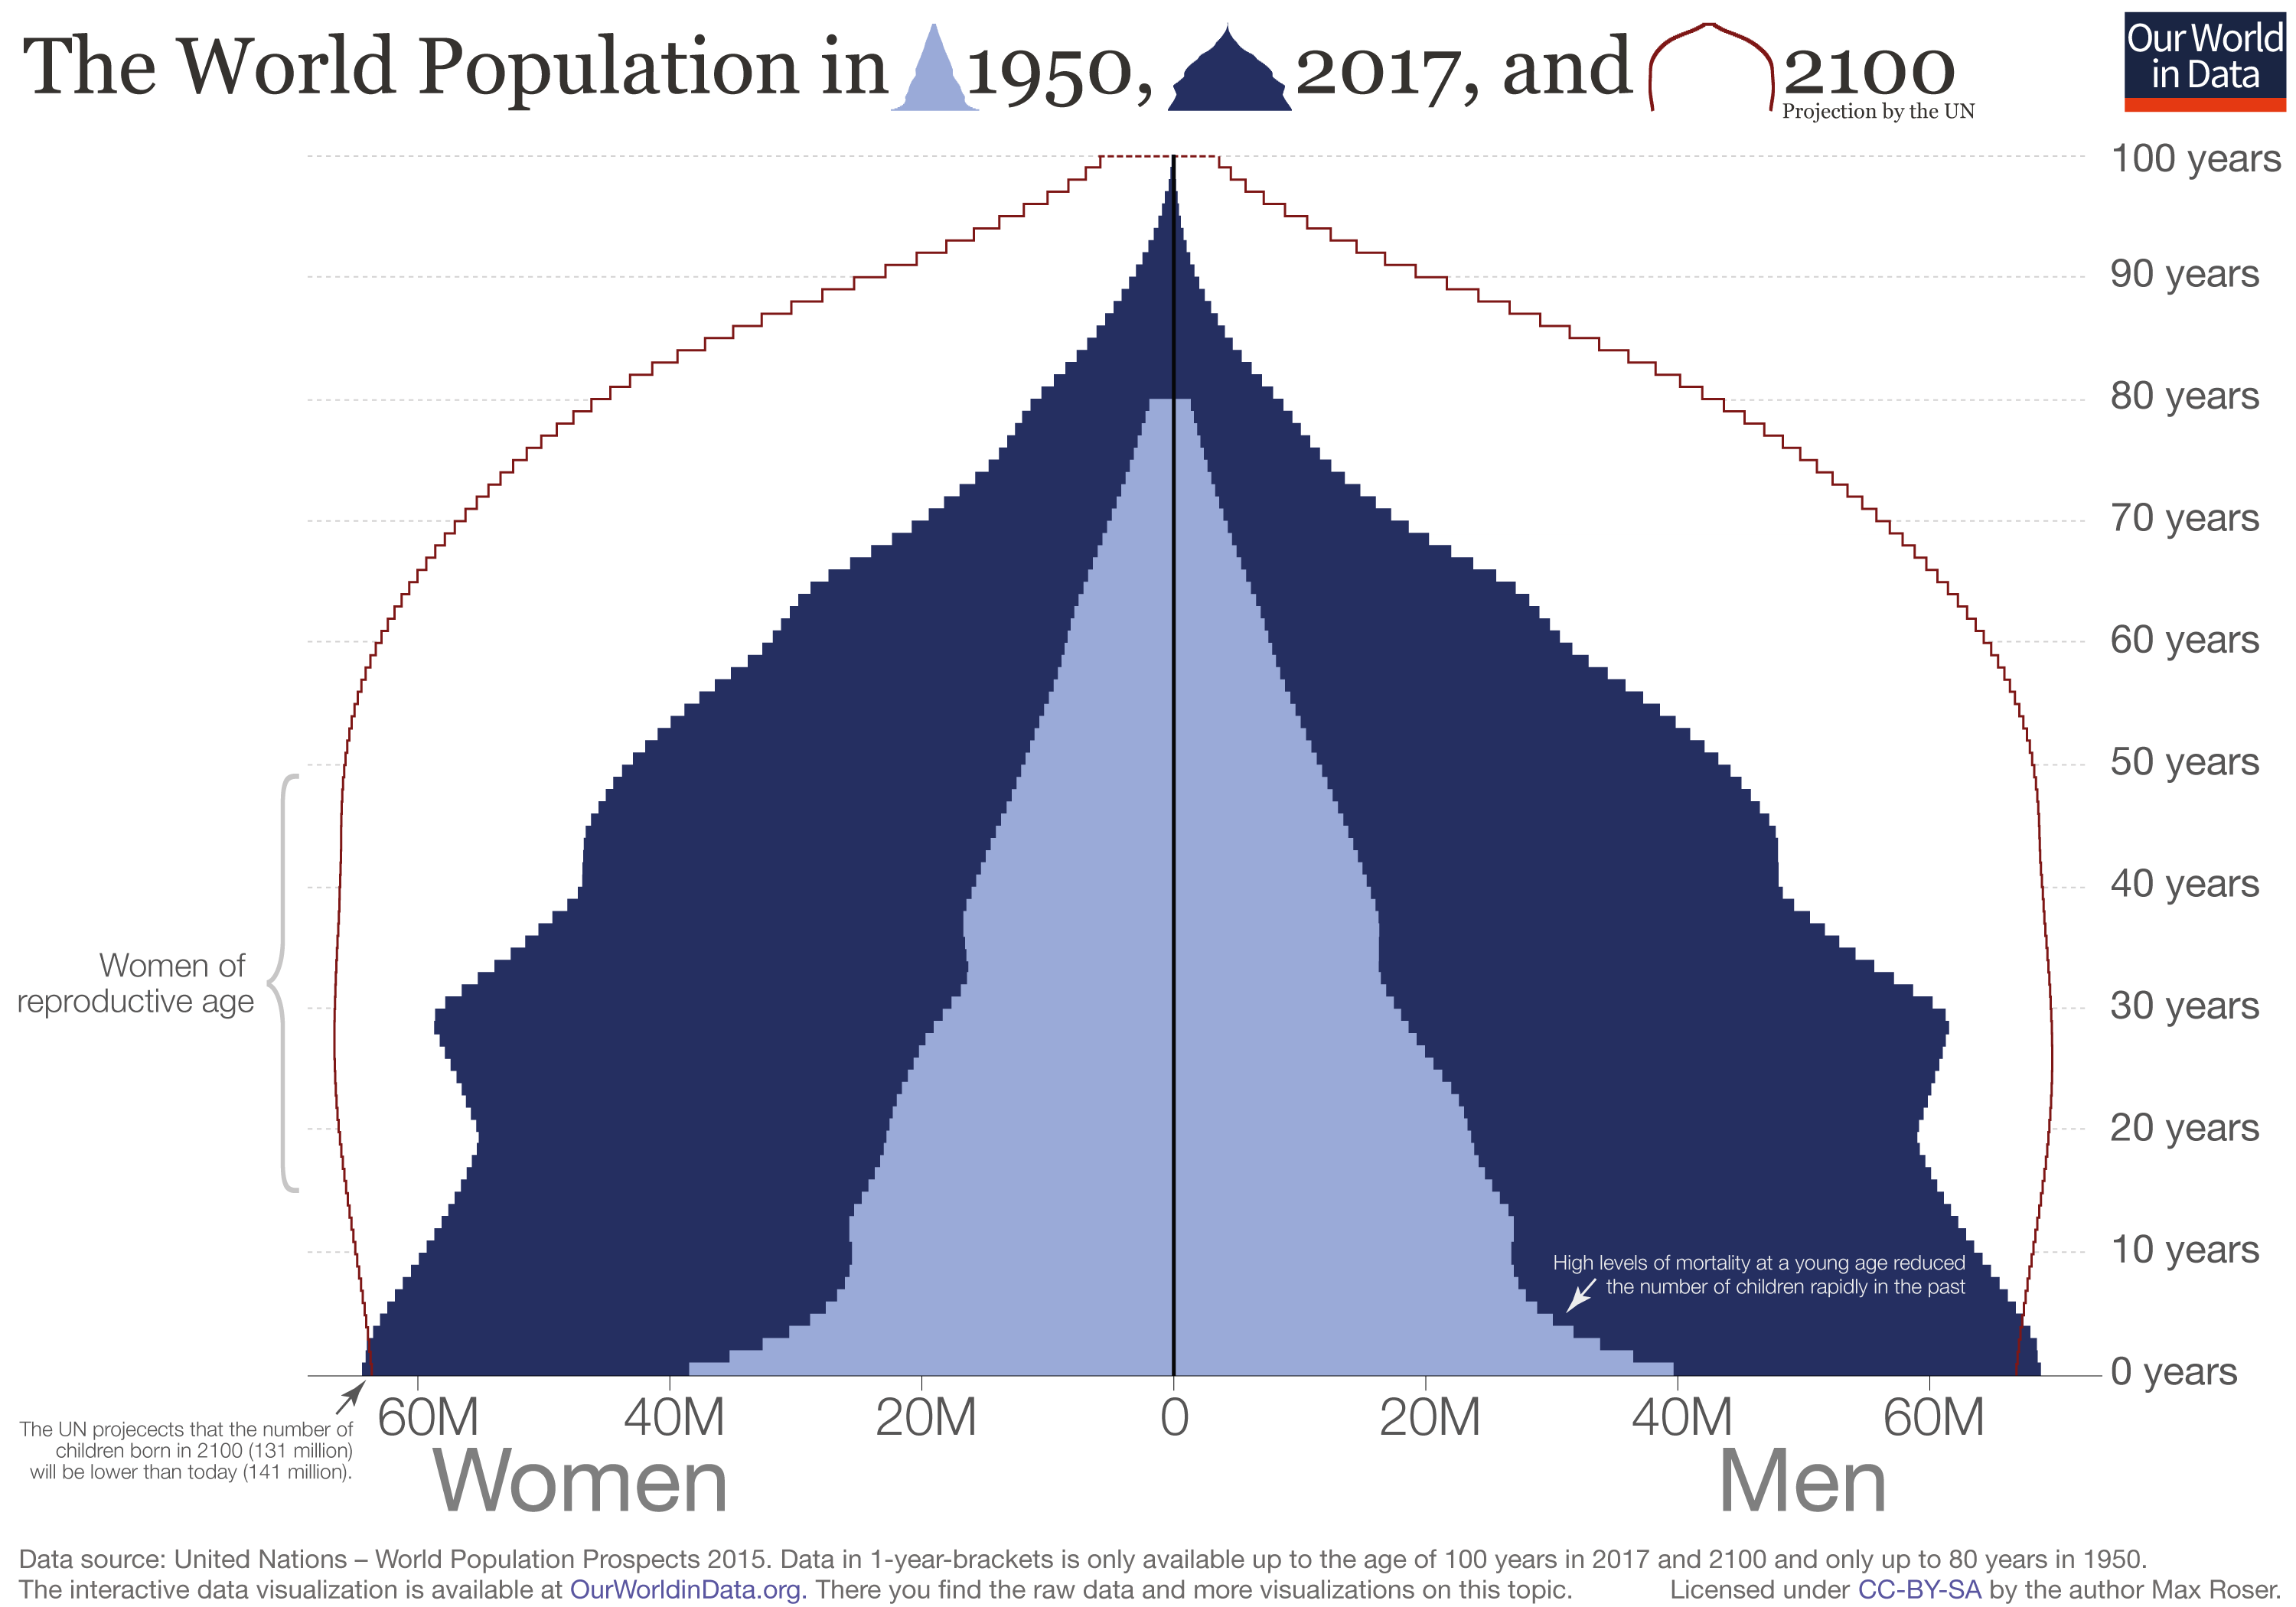
At times when the population pyramid actually resembles a pyramid people are facing the risk to die at any point in their life. The uniform narrowing of the pyramid to the top is evidence of the continuous risk of death from birth on and through all ages. The visualisation here shows this was still the global reality in 1950 – the narrowing of the pyramid just above base is testimony to the fact that in 1950 every fourth child diedbefore it reached the age of five. The continuing narrowing to the top shows the high mortality throughout all ages.
At a time when the top of the pyramid is much wider and the pyramid increasingly resembles a box shape, the population lives through young ages with very low risk of death and dies at an old age. The box shape is the demographic structure of a healthy population. The projection in the visualisation shows that the global demography changes from the pyramid to the box shape – the world population through all ages is becoming increasingly healthier.
In addition to mortality it is also fertility that shapes the form of the demographic structure. The first aspect that matters for the number of new births in a population is the fertility rate, the number of births per woman in the reproductive age. But if there are only few women in reproductive age the number of births will be low even with a high fertility rate. Therefore the age structure of women in a population matters too – specifically it is the share of women in the reproductive age that determines the number of births. A bulge of women in this age keeps the number of birth high even when fertility is already low, this is what demographers refer to as ‘population momentum’. The pyramid for 2016 shows that the largest cohort of women today are the very young women. The last decades of population growth have left us with a bulge of population in the childbearing ages. For this reason the world population will continue to increase, even as the fertility rate of the world is falling to the replacement level fertility.
The World Population Pyramid in 1950, 2017 and 21009

The world is reaching peak children
A second aspect to note regarding the age structure of the world population is how the very young population will change. Here we can see that at the end of the century the base of the structure is narrower than today. There will be fewer children born at the end of this century than today.
The world is approaching what the late Hans Rosling called “the age of peak child”. The solid purple line in the visualisation below indicates the total population of people under the age of 5, and the dotted purple line shows projections for this age group through 2100. As we can see, we are not far away from the largest cohort of children that there will likely ever be. The gray lines show the total world population – we expect an end to population growth as the number of children in the world begins to decrease.
This is an extraordinary moment in global history. In the past only two children per woman reached adulthood – if more had survived the population size would have not been stable. This also means that the extended family with many children, that we often associate with the past, was only a reality for glimpse in time. Only the few generations during the population boom lived in families with many children – before and after two children are the norm. The future will resemble our past, except that the children are not dying, but are never born in the first place.
Between 1950 and today it was mostly a widening of the entire pyramid that was responsible for the increase of the world population. What is responsible for the increase of the world population from now on is not a widening of the the base, but a fill up of the population above the base. Not children will be added to the world population, but people in working age and old age.
At a country level “peak child” is followed by a time in which the country benefits from a “demographic dividend”. The demographic structure of a country is reshaped so that the proportion of people in working age rises and that of the dependent young generation falls. The demographic dividend can result in a rise of productive contributions and a growing economy.10 Now there is reason to expect that the world as a whole benefits from a "demographic dividend".
The big demographic transition that the world entered more than a century ago is coming to an end: Global population growth has peaked half a century ago, the number of babies is reaching its peak, and the age profile of the women in the world is changing so that ‘population momentum’ is slowly losing its momentum. This is not to say that feeding and supporting a still rising world population will be easy, but we are certainly on the way to a new balance where it is not like in our long past when high mortality kept population growth in check, but when it is low fertility that will keep the world population from growing.
World population and projected growth to 2100 (total population and underage 5)Projections are based on UN median estimates. The two series correspond to total population and population under age 5.1950198020002020204020602080210002 billion4 billion6 billion8 billion10 billionProjected total populationProjected population under age 5Source: UN Population Division (2015 Revision)
Change country
II. Correlates, Determinants & Consequences
Population growth is driven by three demographic components: fertility, mortality, and migration. In this section we delve into the drivers of population growth and begin with the widely used model to describe the observed pattern of change — the demographic transition.
II.1 Births and deaths
Population growth results from the difference between births and deaths – the two visualizations below show how these two aspects have changed since 1950.
The difference gives us the global population growth in absolute numbers: Every year 141 million are born and 57 million die – this means that we are adding 84.21 million to the world population every year.
Annual number of births by world region19501960197019801990200020102015020 million40 million60 million80 million100 million120 million140 millionAfricaAsiaLatin America andthe CaribbeanNorthern AmericaEuropeOceaniaSource: UN Population Division (2017 Revision)
Relative
Annual number of deaths by world region19501960197019801990200020102015010 million20 million30 million40 million50 millionAfricaLatin America andthe CaribbeanNorthern AmericaEuropeOceaniaAsiaSource: UN Population Division (2017 Revision)
Relative
II.2 Demographic transition
In the entry on how health has changed over the long run we show the dramatic decline of mortality that the world has seen. And in the entry on fertility we show how socio-economic changes over the course of modernization – a decline of child mortality, structural changes to the economy, and a rise of the status and opportunities for women – all contribute to a very substantial reduction of fertility.
But this alone would not explain why the size of the population increases. What is missing from the picture is the timing at which mortality and fertility changes.
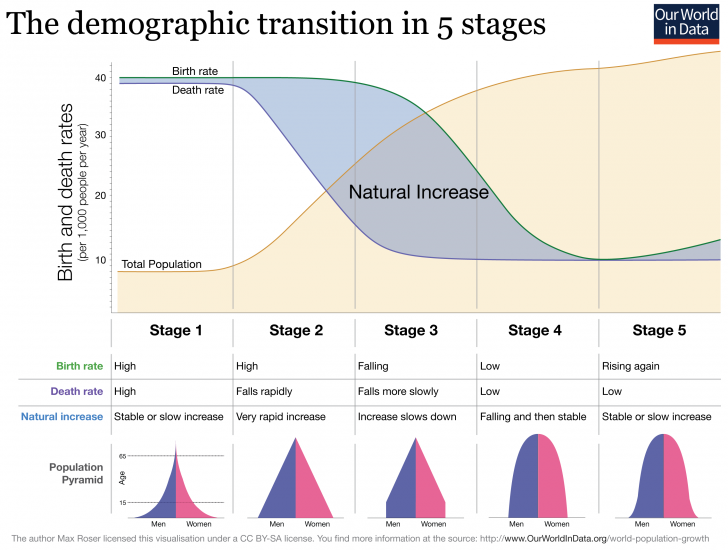
The model in which this information comes together is called the ‘demographic transition’. It is shown in the schematic figure. The model explains the changing size of the total population as driven by the birth and the death rate of the population. It is a beautiful simple model that describes the pattern that we observe in countries around the world and is one of the great insights of demography.11
The five stages of the transition are described below and are illustrated in the graph that follows:
Stage 1: In the long time before modern population growth the birth rate is high, but since the death rate is also high we observe no population growth. This describes the reality through most of our history. Societies around the world remained in stage 1 for millennia.
Stage 2: Then in the second phase the health slowly starts to improve and the death rate is dropping. Since the health of the population has already improved, but fertility still remains as high as before, this is the stage of the transition at which the population increases rapidly. Families do not yet adapt their fertility to the low mortality and have many children.
Historically it is the exceptional time at which the extended family with many children is common.
Stage 3: This is when fertility declines as a result of the social changes: Parents realise that as progress kick in the mortality of children is not as high as it once was and they therefore opt for fewer births, the economy is undergoing structural changes that makes children less economically valuable, and women are empowered socially and within partnerships. The fertility rate is declining steeply.
Stage 4: The population growth comes to an end and in stage 4 as the birth rate catches up with the low mortality rate.
Stage 5: The demographic transition describes changes over the course of socio-economic modernization. What happens at a very high level of development is still not a settled question since only few societies have reached this stage. But we do have some good evidence – which we review in the entry on fertility here – that at very high levels of development fertility is rising again. Not to the very levels of the pre-modern times, but to a fertility rate around 2. As a consequence of this the natural population growth rate will be at 0% or possibly slightly above.
The five stages of demographic transition
Empirical perspective on the demographic transition
If fertility fell in lockstep with mortality we would not have seen an increase in the population at all. The demographic transition works through the asynchronous timing of the two fundamental demographic changes: The decline of the death rate is followed by the decline of birth rates.
This decline of the death rate followed by a decline of the birth rate is something we observe with great regularity and independent of the culture or religion of the population.
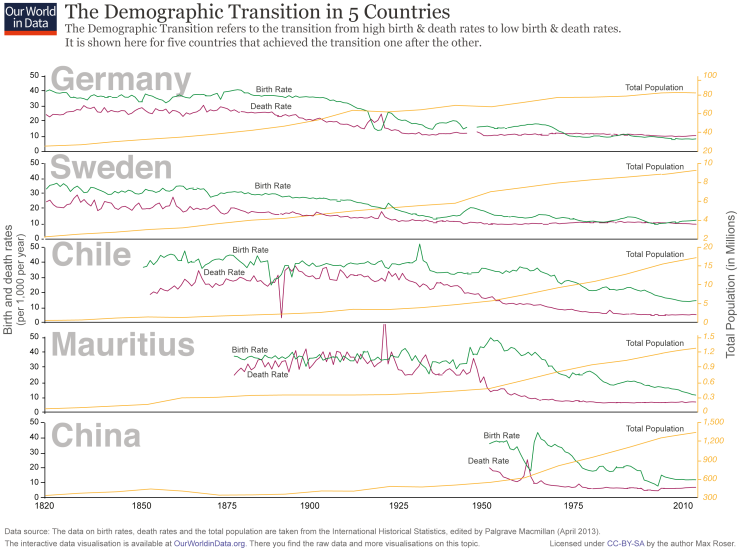
The chart below presents the empirical evidence for the demographic transition for five very different countries in Europe, Latin America, Africa, and Asia. In all countries we observed the pattern of the demographic transition, first a decline of mortality that starts the population boom and then a decline of fertility which brings the population boom to an end. The population boom is a temporary event.
In the past the size of the population was stagnant because of high mortality, now country after country is moving into a world in which the population is stagnant because of low fertility.
Demographic transition in 5 countries, 1820-201012
England and Wales's demographic transition
Perhaps the longest available view of the demographic transition comes from data for England and Wales. In 1981, Anthony Wrigley and Roger Schofield13 published a major research project analyzing English parish registers—a unique source that allowed them to trace demographic changes for the three centuries prior to state records. According to the researchers, "England is exceptionally fortunate in having several thousand parish registers that begin before 1600"; collectively, with their early start and breadth of coverage, these registers form an excellent resource. As far as we know, there is no comparable data for any other country up until the mid-eighteenth century (see the following section for Sweden, where recordkeeping began in 1749).
The chart below shows the birth and death rates in England and Wales over the span of nearly 500 years. It stitches together Wrigley and Schofield's data for the years 1541-1861 with two other sources up to 2015 (click on the chart's 'sources' tab for details). As we can see, a growing gap opens up between the birth and death rate after 1750, creating a population explosion. Around the 1870's, we begin to see the third stage of the demographic transition. As the birth rate starts to follow the death rate's decline, that gap between the two starts to shrink, slowing down the population growth rate.
The Demographic Transition, England and WalesBirth and death rate are expressed per 1,000 of the population1541160017001800190020150510152025303540Crude Birth RateCrude Death RateSource: Our World In Data based on Wrigley and Schofield (1981), Mitchell (2010), and UK ONS (2016)Note: Death rate excludes military losses in 1915-1919; 1939-1946
Sweden's demographic transition
Zooming in on one of these countries, we take a look at Sweden’s demographic transition. The country's long history of population recordkeeping—starting in 1749 with their original statistical office, ‘the Tabellverket’ (Office of Tables)—makes it a particularly interesting case study of the mechanisms driving population change.
Statistics Sweden, the successor of the Tabellverket, publishes data on both deaths and births since recordkeeping began more than 250 years ago. These records suggest that around the year 1800, the Swedish death rate started falling, mainly due to improvements in health and living standards, especially for children.14 Yet while death rates were falling, birth rates remained at a constant pre-modern level until the 1860s. During this period and up until the first half of the 20th century, there was a sustained gap between the frequency of deaths and the frequency of births. It was because of this gap that the Swedish population increased. The following visualization supports these observations.
The Demographic Transition: Decline of the death rate followed by a decline ofthe birth rateBoth the birth and death rate are expressed per 1,000 of the population17491800185019001950201001020304050Sweden - Birth RateSweden - Death RateSource: Brian Mitchell - International Historical Statistics
Add country
Changes to birth and death rate over time around the world
The visualization presents the birth and death rate for all countries of the world over the last 5 decades. You can see the change over by moving the slider underneath back and forth or by pressing the "play" button. Countries per continent can also be highlighted by hovering and clicking on them in the legend on the right side of the chart.
By visualising this change we see how in country after country the death rate fell and the birth rate followed – countries moved to left-hand-side first and then fell to the bottom left corner.
Today, different countries straddle different stages of the model. Most developed countries have reached stage four and have low birth and death rates, while developing countries continue to make their way through the stages.
Birth rate vs Death rate, 2015Both the birth and death rate are given per 1,000 people of the country's population.Deaths per 1,0002468101214Births per 1,000010203040ChinaIndiaUnited StatesBrazilPakistanNigeriaBangladeshRussiaJapanVietnamEthiopiaEgyptGermanyIranDemocratic Republic of CongoThailandSouth AfricaTanzaniaMyanmarSouth KoreaSpainUkraineKenyaAlgeriaIraqSaudi ArabiaGhanaMadagascarCote d'IvoireCameroonAngolaBurkina FasoChileNigerCambodiaZimbabweBelgiumGuineaHaitiSerbiaUnited Arab EmiratesTajikistanJordanCentral African RepublicCroatiaCongoLebanonGeorgiaKuwaitJamaicaLesothoGambiaGabonBahrainCyprusFijiVanuatuGreenlandMonacoTimorPalestineAfricaAsiaEuropeNorth AmericaOceaniaSouth AmericaSource: World Bank – WDI
Search Average annual change
II.3 Fertility and population growth
All countries in the world have moved so far into the demographic transition that high mortality is now associated with higher rather than lower population growth. It is therefore the changing fertility that is determining what happens to population growth.
The below visualization shows the rate of fertility using data from the UN Population Division. Since the 1970s fertility rates in the less developed regions of the world are falling rapidly began to converge. As we see in the projection, the demographers from the UN predict this convergence to continue over the course of this century.
In the entry on fertility, we explain what is behind lower fertility rates — lower child mortality, higher incomes, the education of women, and the availability of contraception.
The total fertility rate by development level including the UN projectionsthrough 2100Total Fertility Rate is defined as the average number of children that would be born to a woman over her lifetime if the woman wereto experience the exact current age-specific fertility rates, and the woman were to survive from birth to the end of her reproductivelife.195019802000202020402060208020990123456Least developed countries - Mediumfertility variantLess developed regions - Mediumfertility variantWorld - Medium fertility variantMore developed regions - Mediumfertility variantSource: UN Population Division (2017 Revision)Note: More developed regions comprise Europe, Northern America, Australia/New Zealand and Japan; less developed regions comprise all regionsof Africa, Asia (excluding Japan), Latin America and the Caribbean plus Melanesia, Micronesia and Polynesia; least developed countries are 48countries, 33 in Africa, 9 in Asia, 5 in Oceania plus one in Latin America and the Caribbean.
Children per woman vs population growth, 2015The rate of natural population increase is the population increase determined by births and deaths. Migration flows arenot taken into account.Children per woman234567Annual Rate of Natural Population Increase0%1%2%3%ChinaIndiaUnited StatesPakistanNigeriaRussiaJapanPhilippinesVietnamEthiopiaIranDemocratic Republic of CongoThailandFranceSouth AfricaColombiaSpainUkraineKenyaAlgeriaIraqAfghanistanGhanaMozambiqueCote d'IvoireBurkina FasoNigerMalawiBelgiumSomaliaIsraelBulgariaTajikistanSierra LeoneKuwaitBelizeSamoaTongaNorthern AfricaAfricaAsiaEuropeNorth AmericaOceaniaSouth AmericaSource: UN Population Division (2017 Revision)
II.4 Child mortality and population growth
In the below visualization, we can see the observed correlation between population growth and child mortality across the world. Countries with high child mortality rates tend to have faster growing populations, while countries with low child mortality rates experience lower population growth rates.
Population growth rate vs Child mortality rate, 2015The child mortality rate measures the share of children that are born alive and die before they are five years old. Therate of natural population increase is determined by births and deaths only and migration flows are not taken intoaccount.Child mortality rate0%2%4%6%8%10%12% LINEARAnnual Rate of Natural Population Increase0%1%2%3%
ChinaIndiaUnited StatesIndonesiaPakistanNigeriaRussiaJapanPhilippinesEthiopiaEgyptIranTurkeyDemocratic Republic of CongoThailandSouth AfricaTanzaniaUkraineKenyaAlgeriaIraqAfghanistanMoroccoGhanaMozambiqueSyriaCote d'IvoireCameroonBurkina FasoNigerMaliMalawiSenegalChadSouth SudanBoliviaIsraelBulgariaTajikistanLaosSierra LeoneIrelandCongoPanamaOmanNamibiaGabonTrinidad and TobagoSwazilandDjiboutiReunionBruneiMayotteAsiaPalestineSerbia (including Kosovo)AfricaAsiaEuropeNorth AmericaOceaniaSouth AmericaSource: UN Population Division (2017 Revision)
1III. Data Quality & Measurement
III.1 Data on the population of the ancient world
Kremer (1993) provides estimates of the total world population over the last 1 million years.15 He puts together UN estimates for the period 1920-1990, as well as estimates from McEvedy and Jones (1978)16 for the period 10,000 BCE-1900 CE, and Deevey (1960)17 for the period 1,000,000 BCE-10,000 BCE.
The estimates from McEvedy and Jones (1978) after 200 BCE were obtained by aggregating population estimates for individual geographic regions taken from other authors (see references therein), and these in turn were based primarily on historical sources such as Roman and Chinese censuses. Their estimates of population prior to 200BCE were based on archaeological and anthropological evidence.
Many studies not considered in Kremer (1993) provide competing estimates of world population over long historical periods (Kremer (1993) mentions Clark (1977)18 and Durand (1977)19, but there are more). The following two graphs provide a sense of the dispersion of different estimates. All long-run estimates appear to be fairly close.
Comparison of different estimates of world population for the last million years - Figure 1 in DeLong (1998)20
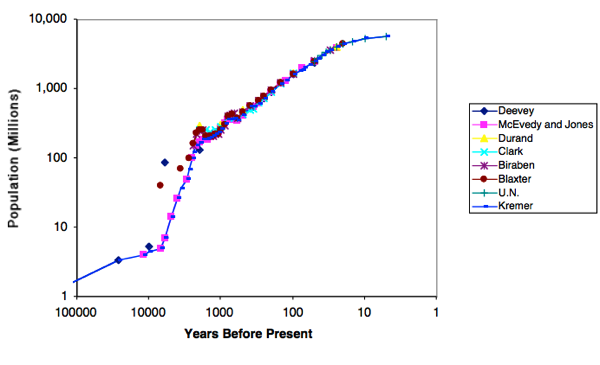
Total World Population – Comparison of different sourcesThis chart compares estimates of the world population published by different sources.10000 BCE8000 BCE6000 BCE4000 BCE2000 BCE019700500 million1 billion1.5 billion2 billion2.5 billion3 billion3.5 billionTuve (1976)McEvedy and Jones (1978)Durand (1974), upperDurand (1974), lowerThomlinson (1975), upperSource: World Population over 12000 years - various sources (2016)
III.2 Data quality of recent world population estimates
The most discussed estimates of world population from the last century are those from the UN Population Division. These estimates are revised periodically and aim to be consistent and comparable within and across countries and time.
The methodology used by the UN to produce their estimates and projections is explained extensively in the World Population Prospects' Methodology Report.
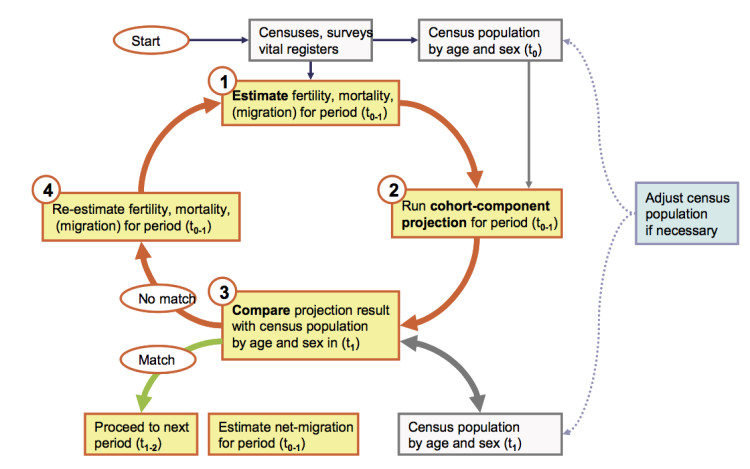
In short, estimates of the population in the past (i.e. 1950-2015) are produced by starting with a base population for 1 July 1950 and computing subsequent populations based on the components that drive population change (fertility, mortality, and international migration). The estimates of these components are taken directly from national statistical sources or—where only partial or poor-quality data exists—are estimated by the Population Division staff. Population counts from periodic censuses are used as benchmarks. This calculation is called the "cohort-component" method because it estimates the change in population by age and sex (cohort) on the basis of the three afore-mentioned demographic components (component): fertility, mortality, and international migration.
The process of 'revising' the estimates involves incorporating new information about the demography of each country. The following diagram explains the process used to ensure consistency.
Process for generating UN population revisions – Table I.4. in the UN World Population Prospects Methodology Report21
One of the main implications of using the cohort-component method is that it sometimes leads to marked inconsistencies with official country statistics. The following map, which shows the coverage of births through civil registration, speaks to this issue: many countries, particularly those in the least developed regions of the world, have limited census data. For countries with no data in one or two decades before each revision, the UN derives estimates by extrapolating trends from countries in the same region with a socio-economic profile considered close to the country in question.
Completeness of birth registration, 2015Completeness of birth registration is the percentage of children under age 5 whose births were registered at the time ofthe survey. The numerator of completeness of birth registration includes children whose birth certificate was seen bythe interviewer or whose mother or caretaker says the birth has been registered.No data0%10%20%30%40%50%60%70%80%90%100%Source: World Bank –
For the completeness of death reporting, see here.
Uncertainty and data quality of related measures
The track record of projections of population growth is discussed in the entry on 'Future Population Growth' here.
IV. Data Sources
IV.1 Estimates of ancient population
As discussed in the previous section, there are a number of studies providing historic population data. The most commonly cited source is McEvedy and Jones (1978).
McEvedy and Jones (1978)
Data Source: McEvedy, Colin and Richard Jones (1978), "Atlas of World Population History," Facts on File, New York, pp. 342-351; relying on archeological and anthropological evidence, as well as historical documents such as Roman and Chinese censuses
Description of available measures: Population
Time span: 400BCE-2,000CE
Geographical coverage: Global by country and regions
This above source is an input used in producing the HYDE project data, as well as other datasets. Further references to this source are available in Goldewijk, K. K., Beusen, A., & Janssen, P. (2010). Long-term dynamic modelling of global population and built-up area in a spatially explicit way: HYDE 3.1. The Holocene.
History Database of the Global Environment (HYDE)
Data Source: History Database of the Global Environment project, using estimates from McEvedy and Jones (1978), Livi-Bacci (2007)22, Maddison (2001)23, and Denevan (1992)24
Description of available measures: Geographic distribution of the world population
Time span: 10,000BCE-2,000CE
Geographical coverage: Global at a 5 arc-minute spatial resolution
Link:http://themasites.pbl.nl/tridion/en/themasites/hyde/basicdrivingfactors/population/index-2.html
The data from the HYDE project is in turn the basis for the population series published by the 'Clio-Infra' project
Clio-Infra
Data Source: HYDE project and UN Population Division
Description of available measures: Population
Time span: 1,500-2,000CE
Geographical coverage: Global by country
Link: www.clio-infra.eu/
IV.2 Estimates of population in recent history and projections
UN Population Database
Data Source: UN Population Division based on 'cohort-component' framework by demographic trends (see Data Quality section)
Description of available measures:
◦ Population, by Five-Year Age Group and Sex
◦ Population Sex Ratio (males per 100 females)
◦ Median Age
◦ Population Growth Per Year
◦ Crude Birth Rate
◦ Crude Death Rate
◦ Net Reproduction Rate
◦ Total Fertility Rate
◦ Life Expectancy at Birth by Sex
◦ Net Migration Rate
◦ Sex ratio at birth
◦ Births
◦ Births by Age-group of Mother
◦ Age-specific Fertility Rates
◦ Women Aged 15-49
◦ Deaths by Sex
◦ Infant Mortality
◦ Mortality Under Age 5
◦ Dependency Ratios
◦ Population by Age: 0-4, 0-14, 5-14, 15-24, 15-59, 15-64, 60+, 65+, 80+
Time span: 1950-2015
Geographical coverage: Global by country
Link: http://esa.un.org/unpd/wpp/
Gridded Population of the World (GPW)
Data Source: Center for International Earth Science Information Network (CIESIN), published by the Socioeconomic Data and Applications Center (SDAC) based on census data
Description of available measures: Population
Time span: 1990-2010
Geographical coverage: Global at a 2.5 arc-minute spatial resolution
Link: http://sedac.ciesin.columbia.edu/data/collection/gpw-v3
Notes: Within the CIESIN, the Anthropogenic Biomes map the distribution of the world population at different points in time: 1700, 1800, 1900, 2000. These maps focus on the varying impact of humans on the environment.
LandScan
Data Publisher: University of Iowa (originally developed by the Oak Ridge National Laboratory (ORNL) for the Department of Defense, U.S.)
Data Source: Annual mid-year national population estimates from the Geographic Studies Branch, US Bureau of Census
Description of available measures: Population and 'ambient population' (a measure of person-hours accounting for varying presence throughout the day in commercial areas)
Time span: 1998-2012, but authors warn of inter-temporal comparability issues
Geographical coverage: Global at 30 arc-second grid spatial resolution (highest population resolution available)
Link: http://sedac.ciesin.columbia.edu/data/collection/gpw-v3
World Development Indicators
Data Publisher: World Bank
Data Source: UN Population Division
Description of available measures: Population growth (annual %)
Time span: 1981-2015
Geographical coverage: Global by country
Link: http://data.worldbank.org/indicator/
IV.3 Compilations of census data and other sources
Historical population data on a sub-national level – including their administrative divisions and principal towns – is collected by Jan Lahmeyer and published at his website www.populstat.info.
The Minnesota Population Center publishes various high-quality datasets based on census data beginning in 1790. At the time of writing this source was online at www.pop.umn.edu/index.php. It focuses on North America and Europe.
The Data & Information Services Center (DISC) Archive at University of Wisconsin-Madison provides access to census data and population datasets (mostly for the Americas). At the time of writing this source was online at http://www.disc.wisc.edu.
The International Database published by the U.S. Census Bureau provides data for the time 1950-2100. At the time of writing this source was online at https://www.census.gov/data-tools/demo/idb/informationGateway.php.
The Atlas of the Biosphere publishes data on Population Density. At the time of writing this source was online at www.sage.wisc.edu/atlas/maps.
Footnotes
As per estimates from Michael Kremer (1993) “Population Growth and Technological Change: One Million B.C. to 1990″, Quarterly Journal of Economics., August 1993, pp.681-716.
As per 2011 estimates from Carl Haub (2011), "How Many People Have Ever Lived on Earth?" Population Reference Bureau.
World population until 2015 – Our World In Data series (see below)
World population projection 2016 to 2100 is the UN Medium Variant from the 2015 revision published by the UN Population Division
As per 2011 estimates from Carl Haub (2011), "How Many People Have Ever Lived on Earth?" Population Reference Bureau.
See for example Kremer (1993) – Population growth and technological change: one million BC to 1990. In the Quarterly Journal of Economics, Vol. 108, No. 3, 681-716. Online here.
John Hawks, Keith Hunley, Sang-Hee Lee, Milford Wolpoff; Population Bottlenecks and Pleistocene Human Evolution, Molecular Biology and Evolution, Volume 17, Issue 1, 1 January 2000, Pages 2–22. Online here.
OurWorldInData annual world population series (based on HYDE and UN) until 2015. UN Medium Variant Projection after 2015 (2015 Revision)
OurWorldInData annual world population series (based on HYDE and UN) until 2015. UN Medium Variant Projection after 2015 (2015 Revision)
Data source: United Nations—World Population Prospects 2015
For more information on the "population dividend" see: http://www.unfpa.org/demographic-dividend
For a history and literature review of the theory's development, see: Kirk, Dudley. “Demographic transition theory.” Population studies 50.3 (1996): 361-387. Available online here
The data on birth rates, death rates and the total population is taken from the International Historical Statistics (IHS), edited by Palgrave Macmillan Ltd. (April 2013). The online version is available here. As a printed version it is published by Palgrave.
Wrigley, E. A., Schofield, R. S., & Schofield, R. (1989). The population history of England 1541-1871. Cambridge University Press.
Before 1800 more than 20% of Swedish babies died before they reached their first birthday, and of those who survived, another 20% died before their 10th birthday (see Croix, Lindh, and Malmberg (2009), Demographic change and economic growth in Sweden: 1750–2050. In Journal of Macroeconomics, 31, 1, 132--148).
Michael Kremer (1993) "Population Growth and Technological Change: One Million B.C. to 1990", Quarterly Journal of Economics., August 1993, pp.681-716.
McEvedy, Colin and Richard Jones (1978), "Atlas of World Population History," Facts on File, New York, pp. 342-351.
Deevey, Edward S. "The human population." Scientific American 203 (1960): 194-204.
Clark, Colin (1997). "Population growth and land use." London: Macmillan.
Durand, John D. (1974), "Historical Estimates of World Population: An Evaluation," Population and Development Review III, 253-96.
J. Bradford DeLong (1998) "Estimating World GDP, One Million B.C. - Present".
UN World Population Prospects Methodology Report
Livi-Bacci (2007), "A Concise History of World Population". Oxford: Blackwell Publishing.
Maddison, A. (2001). The World Economy: A Millennial Perspective, Development Centre of the Organization for Economic Cooperation and Development.
Denevan, W. M. (1992). The pristine myth: the landscape of the Americas in 1492. Annals of the Association of American Geographers, 82(3), 369-385.
www.fotavgeia.blogspot.com
by Max Roser and Esteban Ortiz-Ospina[cite]
First published in 2013; updated April, 2017.
200 years ago there were less than one billion humans living on earth. Today, according to UN calculations there are over 7 billion of us.1 Recent estimates suggest that today's population size is roughly equivalent to 6.5% of the total number of people ever born.2This is the most conspicuous fact about world population growth: for thousands of years, the population grew only slowly but in recent centuries, it has jumped dramatically. Between 1900 and 2000, the increase in world population was three times greater than during the entire previous history of humanity—an increase from 1.5 to 6.1 billion in just 100 years.
How the world population is changing is of great importance for humanity’s impact on the Earth’s natural environment, but it also gives reasons to hope for a good future. This is because we have a bigger team of better educated people who can contribute to the solutions that improve global well-being.
A picture of the world population in the very long-run shows extremely rapid growth. Indeed, for a long time the world population grew at an increasing rate. However, if we focus on the last couple of decades, we see that this pattern no longer holds, as the annual rate of population growth has been recently going down. 1962 saw the growth rate peak at 2.1%, and it has since fallen to almost half. A long historical period of accelerated growth has thus come to an end.
Based on these observations, world history can be divided into three periods marked by distinct trends in population growth. The first period, pre-modernity, was a very long age of very slow population growth. The second period, beginning with the onset of modernity—which was characterized by rising standards of living and improving health—had an increasing growth rate that continued to rise through 1962. Today, the second period is over, and the third period is unfolding; the population growth rate is falling and will likely continue to fall, leading to an end of population growth towards the end of this century.
I. Empirical View
I.1 Population size vs. population growth rate
In order to study how the world population changes over time, it is useful to consider the rate of change rather than focusing only on the total population level. The following visualization presents the annual population growth rate superimposed over the total world population for the period 1750-2010, as well as projections up to 2100. This is the period in history when population growth changed most drastically. Before 1800, the world population growth rate was always well below 1%. Over the course of the first fifty years of the 20th century, however, annual growth increased to up to 2.1%—the highest annual growth rate in history, which was recorded in 1962. Since peaking, the growth rate has systematically been going down, with projections estimating an annual rate of 0.1% for 2100.
This means that while the world population quadrupled in the 20th century, it will not double in the 21st century.
World population, 1750-2015 and projections until 21003

I.2 Long-run historical perspective
World Population from 10,000 BCE to 2100 CE
The chart below shows the the increasing number of people living on our planet over the last 12,000 years. A mind boggling change: The world population today that is 1,860-times the size of what it was 12 millennia ago when the world population was around 4 million or half of the current population of London.
What is striking about this chart is of course that almost the entire action happened just very recently. Historical demographers estimate that around the year 1800 the world population was only around 1 billion people. This implies that on average the population grew very slowly over this long time from 10,000 BCE to 1700 (by 0.04% annually).
After 1800 this changed fundamentally: The world population was around 1 billion in the year 1800 and increased 7-fold since then.
Around 108 billion people have ever lived on our planet. This means that today's population size makes up 6.5% of the total number of people ever born.4
The visualization allows you to add the UN's projected population increase through the end of the 21st century as estimated in their Medium Variant (for more detail on the UN's population estimates, see below). Hovering your mouse over the plotted line will show you population figures for each year.
For the long period from the appearance of modern Homo sapiens up to the starting point of this chart in 10,000 BCE it is estimated that the total world population was often well under one million.5 In this period our species was often seriously threatened by extinction.6
World Population over the last 12,000 years and UN projection until 210010000 BCE8000 BCE6000 BCE4000 BCE2000 BCE0210002 billion4 billion6 billion8 billion10 billion LINEAR
Source: World Population over 12000 years - various sources (2016), Medium Projection – UN Population Division (2015 revision)
Download the annual world population data published by Our World in Data
How often does the world population double?
The visualisation below presents a different perspective on the long-term increase of the world population and asks how long it took for the world population to double.
The visualisation shows how strongly the growth rate of the world population changed over time: In the past the population grew slowly: it took nearly seven centuries for the population to double from 0.25 billion (in the early 9th century) to 0.5 billion in the middle of the 16th century. As the growth rate slowly climbed, the population doubling time fell but remained in the order of centuries into the first half of the 20th century. Things sped up considerably in the middle of the 20th century. The fastest doubling of the world population happened between 1950 and 1987: a doubling from 2.5 to 5 billion people in just 37 years — the population doubled within a little more than one generation. This period was marked by a peak population growth of 2.1% in 1962.
Since then, population growth has been slowing, and along with it the doubling time. In this visualisation we have used the UN projections to show how the doubling time is projected to change until the end of this century. By 2088, it will once again have taken nearly 100 years for the population to double to a predicted 11 billion.
Time it took for the world population to double7
Time taken for population to increase by one billion
The visualisation below provides an additional perspective on population growth: the number of years it took to add one billion to the global population. Also shown in this figure is the number of years projected up to 11 billion based on the UN's 'medium variant' projection.
This visualisation shows again how the population growth rate has changed dramatically through time. It wasn't until 1803 that the world reached its first billion; it then took another 124 years to reach two billion. By the third billion, this period had reduced to 33 years, reduced further to 15 years to reach four. The period of fastest growth occurred through 1975 to 2011, taking only 12 years to increase by one billion for the 5th, 6th and 7th.
The world has now surpassed this peak rate of growth, and the period between each billion is expected to continue to rise. It's estimated to take approximately 13 years to reach eight billion in 2024; a further 14 years to reach 9 billion in 2038; 18 years to reach 10 billion in 2056; and a further 29 years to reach the 11th billion in 2088.
Time it took for the world population to increase by one billion8
I.3 Country trends over the last centuries
The global pattern masks a great deal of heterogeneity across countries; faster population growth started at different points in time in each country. The following visualization shows total population by country in the last centuries.
The data below shows the latest UN data for the time since 1950 and the estimates published by Gapminder for the period before.
Data from Clio-Infra on the population by country over the last 500 years can be seen in this chart. Substantial differences are evident here: adding the U.S. to the graph reveals that, while the population in France roughly doubled in the period 1800-2000, in this same period the population in the U.S. increased almost 50-fold.
This also meant that the population density increased rapidly in many countries, as can be seen on this interactive visualization.
Population by country17001750180018501900195020160200 million400 million600 million800 million1 billion1.2 billion1.4 billionChinaIndiaUnited StatesBrazilSource: Gapminder until 1949, UN Population Division from 1950-
I.4 Shares by world regions
The estimates provided by the History Database of the Global Environment (HYDE) are shown in the following visualization that provides a break down of the world population by world regions.
Asia is – and has been for a long time – the most populous region in the world.
World population by world regions18201850190019502000201601 billion2 billion3 billion4 billion5 billion6 billion7 billionNorth and CentralAmericaSouth AmericaOceaniaEuropeAsiaAfricaSource: Global Population by Region - HYDE (2016)
I.5 Recent history and projections
In terms of recent developments, the data from the UN Population Division provides consistent and comparable estimates (and projections) within and across countries and time, over the last century. This data starts from estimates for 1950, and is updated periodically to reflect changes in fertility, mortality and international migration (for more information see the Data Quality section at the end of this entry).
The global population growth rate peaked long ago
The chart below shows that global population growth reached a peak in 1962 and 1963 with an annual growth rate of 2.2%; but since then, world population growth was halved.
For the last half-century we have lived in a world in which the population growth rate has been declining. The UN projects that this decline will continue in the coming decades.
The absolute increase of the population per year has peaked in the late 1980s at over 90 million additional people each year and can be seen here.
Natural population growth
'Natural population growth' measures the rate of population increase as determined solely by births and deaths. Migration flows are not taken into account.
The map below illustrates the rate of natural population growth by country from 1955 to 2015 (use the slider underneath the map to change years).
We see that there are some countries today where the natural population growth is slightly negative: the number of deaths exceed the number of births. When we move the time slider underneath the map to past years, we see that this is a new phenomenon. Up until the 1970s, there were no countries with a negative natural population growth.
Worldwide, population growth is slowing—you can press the play arrow at the bottom of the chart to see the change over time.
Natural population growth, 2015Natural population growth is the population increase determined by births and deaths. Migration flows are not takeninto account.No data<-1 .5="" br="" division="" increase="" natural="" of="" ource:="" population="" rate="" un="">
1Population growth by country
The following visualization presents the rate of population growth by country—and here, migration flows are taken into account in addition to the population growth determined by births and deaths. The chart shows data for the period 1955-2015, plus projections for 2015-2100 using the UN Population Division data.
You can toggle the visualization from chart to map view for a wider, cross-country comparison. As you can see, growth rates in most countries have been going down since the 1960s. Yet substantial differences exist across countries and regions. While Western Europe's growth rates are currently close to zero, sub-Saharan Africa's rates remain higher than 3%—that is, still higher than the peak growth rates recorded for the world at the beginning of the 1960s. Moreover, in many cases there has been divergence in growth rates. For instance, while India and Nigeria had similar growth rates in 1960 (around 1.7%), they took very different paths in the following years and thus currently have populations that grow at very different rates (about 1.26% for India compared to 2.67% for Nigeria).
Population growth rate, 2015Average annual rate of population change (including the UN's 'Medium variant' projections until 2100)No data<-6>6%Source: UN Population Division (2017 Revision)
Population growth by the level of development
The following visualization presents how the population growth rate has changed for 'more developed', 'less developed' and 'least developed' countries (UN categorization), and how they are projected to change through 2100 (UN Population Division estimates and projections from the 2015 revision).
Developed countries reached the fastest growth rates longer ago and the population growth rates there have been falling for many decades. The less developed countries' growth rate peaked in the late 1960s and in the least developed countries the population growth rate peaked around 1990.
Over the last two decades we are seeing declining population growth rates in countries at all stages of development.
Population growth rate by world region, 1955-2015 and projections through2100Projections use the UN medium variant195019802000202020402060208020990%0.5%1%1.5%2%2.5%More developed regions - Projectedgrowth rateLess developed regions - Projectedgrowth rateLeast developed countries - Projectedgrowth rateSource: UN Population Division (2017 Revision)Note: More developed regions comprise Europe, Northern America, Australia/New Zealand and Japan; less developed regions comprise all regionsof Africa, Asia (excluding Japan), Latin America and the Caribbean plus Melanesia, Micronesia and Polynesia; least developed countries are 48countries, 33 in Africa, 9 in Asia, 5 in Oceania plus one in Latin America and the Caribbean.
Population density
The above discussion also shows that there are interesting patterns of population density: the most densely populated regions today have also been the most densely populated regions throughout modern history. India is a prime example of this. The following visualization shows population density patterns by country using data from the History Database of the Global Environment (HYDE). Switch to the map view for a global perspective.
Population densityNumber of inhabitants per square kilometer.5000 BCE4000 BCE3000 BCE2000 BCE1000 BCE010002100050100150200 LINEAR
Population projections based on education levels
The International Institute for Applied Systems Analysis (IIASA) is an interdisciplinary, highly-respected research institution near Vienna, Austria. The IIASA population projections are the most cited alternative to the UN work.
Interestingly, their medium projection for population growth (which they consider most likely) stands in stark contrast to the UN projection. While the medium variant of the UN projection sees the world population growing continuously throughout the 21st century, the IIASA medium scenario sees the world population increase to 9.4 billion in 2070, and then begin a slow decline to reach below 9 billion by the end of the century.
As the IIASA researchers explain, there are important methodological differencesbetween the UN and IIASA projections. The UN uses probabilistic population projections to extrapolate populations for each country over the 21st century and applies the same statistical methodology to all countries. In contrast, the IIASA researchers have a country-specific approach that takes into account the knowledge of experts for each country separately.
The other important feature of the IIASA projection is that it takes into account how educated a given population is. As we show below, there is a strong link between education and fertility—more educated women have fewer children. This link is factored into IIASA's model and contributes to their projection of a much smaller total world population over the course of the 21st century.
Breaking down the population by education level is especially interesting: we see that our world will be inhabited by more and more educated people. The visualization below shows that in 1970 there were only around 700 million people in the world who had secondary or post-secondary education. By the end of this century, the number of people with secondary or post-secondary education will have increased 10-fold and will reach 7 billion people (a figure similar to the entire current world population)!
The projection also shows that the number of people with no education will decrease continuously and that by the end of this century virtually all people in the world will have received some level of education.
Projected world population by level of educationThis visualization shows the Medium projection by the International Institute for Applied Systems Analysis (IIASA). Theresearchers who created this projection describe it as their "middle of the road scenario that can also be seen as themost likely path".1970198020002020204020602080210002 billion4 billion6 billion8 billionPost SecondaryUpper SecondaryLower SecondaryPrimaryIncomplete PrimaryNo EducationUnder 15Source: Global Projection, Medium SSP2 - IIASA (2016)
I.6 How will the global demography change?
At times when the population pyramid actually resembles a pyramid people are facing the risk to die at any point in their life. The uniform narrowing of the pyramid to the top is evidence of the continuous risk of death from birth on and through all ages. The visualisation here shows this was still the global reality in 1950 – the narrowing of the pyramid just above base is testimony to the fact that in 1950 every fourth child diedbefore it reached the age of five. The continuing narrowing to the top shows the high mortality throughout all ages.
At a time when the top of the pyramid is much wider and the pyramid increasingly resembles a box shape, the population lives through young ages with very low risk of death and dies at an old age. The box shape is the demographic structure of a healthy population. The projection in the visualisation shows that the global demography changes from the pyramid to the box shape – the world population through all ages is becoming increasingly healthier.
In addition to mortality it is also fertility that shapes the form of the demographic structure. The first aspect that matters for the number of new births in a population is the fertility rate, the number of births per woman in the reproductive age. But if there are only few women in reproductive age the number of births will be low even with a high fertility rate. Therefore the age structure of women in a population matters too – specifically it is the share of women in the reproductive age that determines the number of births. A bulge of women in this age keeps the number of birth high even when fertility is already low, this is what demographers refer to as ‘population momentum’. The pyramid for 2016 shows that the largest cohort of women today are the very young women. The last decades of population growth have left us with a bulge of population in the childbearing ages. For this reason the world population will continue to increase, even as the fertility rate of the world is falling to the replacement level fertility.
The World Population Pyramid in 1950, 2017 and 21009
The world is reaching peak children
A second aspect to note regarding the age structure of the world population is how the very young population will change. Here we can see that at the end of the century the base of the structure is narrower than today. There will be fewer children born at the end of this century than today.
The world is approaching what the late Hans Rosling called “the age of peak child”. The solid purple line in the visualisation below indicates the total population of people under the age of 5, and the dotted purple line shows projections for this age group through 2100. As we can see, we are not far away from the largest cohort of children that there will likely ever be. The gray lines show the total world population – we expect an end to population growth as the number of children in the world begins to decrease.
This is an extraordinary moment in global history. In the past only two children per woman reached adulthood – if more had survived the population size would have not been stable. This also means that the extended family with many children, that we often associate with the past, was only a reality for glimpse in time. Only the few generations during the population boom lived in families with many children – before and after two children are the norm. The future will resemble our past, except that the children are not dying, but are never born in the first place.
Between 1950 and today it was mostly a widening of the entire pyramid that was responsible for the increase of the world population. What is responsible for the increase of the world population from now on is not a widening of the the base, but a fill up of the population above the base. Not children will be added to the world population, but people in working age and old age.
At a country level “peak child” is followed by a time in which the country benefits from a “demographic dividend”. The demographic structure of a country is reshaped so that the proportion of people in working age rises and that of the dependent young generation falls. The demographic dividend can result in a rise of productive contributions and a growing economy.10 Now there is reason to expect that the world as a whole benefits from a "demographic dividend".
The big demographic transition that the world entered more than a century ago is coming to an end: Global population growth has peaked half a century ago, the number of babies is reaching its peak, and the age profile of the women in the world is changing so that ‘population momentum’ is slowly losing its momentum. This is not to say that feeding and supporting a still rising world population will be easy, but we are certainly on the way to a new balance where it is not like in our long past when high mortality kept population growth in check, but when it is low fertility that will keep the world population from growing.
World population and projected growth to 2100 (total population and underage 5)Projections are based on UN median estimates. The two series correspond to total population and population under age 5.1950198020002020204020602080210002 billion4 billion6 billion8 billion10 billionProjected total populationProjected population under age 5Source: UN Population Division (2015 Revision)
Change country
II. Correlates, Determinants & Consequences
Population growth is driven by three demographic components: fertility, mortality, and migration. In this section we delve into the drivers of population growth and begin with the widely used model to describe the observed pattern of change — the demographic transition.
II.1 Births and deaths
Population growth results from the difference between births and deaths – the two visualizations below show how these two aspects have changed since 1950.
The difference gives us the global population growth in absolute numbers: Every year 141 million are born and 57 million die – this means that we are adding 84.21 million to the world population every year.
Annual number of births by world region19501960197019801990200020102015020 million40 million60 million80 million100 million120 million140 millionAfricaAsiaLatin America andthe CaribbeanNorthern AmericaEuropeOceaniaSource: UN Population Division (2017 Revision)
Relative
Annual number of deaths by world region19501960197019801990200020102015010 million20 million30 million40 million50 millionAfricaLatin America andthe CaribbeanNorthern AmericaEuropeOceaniaAsiaSource: UN Population Division (2017 Revision)
Relative
II.2 Demographic transition
In the entry on how health has changed over the long run we show the dramatic decline of mortality that the world has seen. And in the entry on fertility we show how socio-economic changes over the course of modernization – a decline of child mortality, structural changes to the economy, and a rise of the status and opportunities for women – all contribute to a very substantial reduction of fertility.
But this alone would not explain why the size of the population increases. What is missing from the picture is the timing at which mortality and fertility changes.
The model in which this information comes together is called the ‘demographic transition’. It is shown in the schematic figure. The model explains the changing size of the total population as driven by the birth and the death rate of the population. It is a beautiful simple model that describes the pattern that we observe in countries around the world and is one of the great insights of demography.11
The five stages of the transition are described below and are illustrated in the graph that follows:
Stage 1: In the long time before modern population growth the birth rate is high, but since the death rate is also high we observe no population growth. This describes the reality through most of our history. Societies around the world remained in stage 1 for millennia.
Stage 2: Then in the second phase the health slowly starts to improve and the death rate is dropping. Since the health of the population has already improved, but fertility still remains as high as before, this is the stage of the transition at which the population increases rapidly. Families do not yet adapt their fertility to the low mortality and have many children.
Historically it is the exceptional time at which the extended family with many children is common.
Stage 3: This is when fertility declines as a result of the social changes: Parents realise that as progress kick in the mortality of children is not as high as it once was and they therefore opt for fewer births, the economy is undergoing structural changes that makes children less economically valuable, and women are empowered socially and within partnerships. The fertility rate is declining steeply.
Stage 4: The population growth comes to an end and in stage 4 as the birth rate catches up with the low mortality rate.
Stage 5: The demographic transition describes changes over the course of socio-economic modernization. What happens at a very high level of development is still not a settled question since only few societies have reached this stage. But we do have some good evidence – which we review in the entry on fertility here – that at very high levels of development fertility is rising again. Not to the very levels of the pre-modern times, but to a fertility rate around 2. As a consequence of this the natural population growth rate will be at 0% or possibly slightly above.
The five stages of demographic transition
Empirical perspective on the demographic transition
If fertility fell in lockstep with mortality we would not have seen an increase in the population at all. The demographic transition works through the asynchronous timing of the two fundamental demographic changes: The decline of the death rate is followed by the decline of birth rates.
This decline of the death rate followed by a decline of the birth rate is something we observe with great regularity and independent of the culture or religion of the population.
The chart below presents the empirical evidence for the demographic transition for five very different countries in Europe, Latin America, Africa, and Asia. In all countries we observed the pattern of the demographic transition, first a decline of mortality that starts the population boom and then a decline of fertility which brings the population boom to an end. The population boom is a temporary event.
In the past the size of the population was stagnant because of high mortality, now country after country is moving into a world in which the population is stagnant because of low fertility.
Demographic transition in 5 countries, 1820-201012
England and Wales's demographic transition
Perhaps the longest available view of the demographic transition comes from data for England and Wales. In 1981, Anthony Wrigley and Roger Schofield13 published a major research project analyzing English parish registers—a unique source that allowed them to trace demographic changes for the three centuries prior to state records. According to the researchers, "England is exceptionally fortunate in having several thousand parish registers that begin before 1600"; collectively, with their early start and breadth of coverage, these registers form an excellent resource. As far as we know, there is no comparable data for any other country up until the mid-eighteenth century (see the following section for Sweden, where recordkeeping began in 1749).
The chart below shows the birth and death rates in England and Wales over the span of nearly 500 years. It stitches together Wrigley and Schofield's data for the years 1541-1861 with two other sources up to 2015 (click on the chart's 'sources' tab for details). As we can see, a growing gap opens up between the birth and death rate after 1750, creating a population explosion. Around the 1870's, we begin to see the third stage of the demographic transition. As the birth rate starts to follow the death rate's decline, that gap between the two starts to shrink, slowing down the population growth rate.
The Demographic Transition, England and WalesBirth and death rate are expressed per 1,000 of the population1541160017001800190020150510152025303540Crude Birth RateCrude Death RateSource: Our World In Data based on Wrigley and Schofield (1981), Mitchell (2010), and UK ONS (2016)Note: Death rate excludes military losses in 1915-1919; 1939-1946
Sweden's demographic transition
Zooming in on one of these countries, we take a look at Sweden’s demographic transition. The country's long history of population recordkeeping—starting in 1749 with their original statistical office, ‘the Tabellverket’ (Office of Tables)—makes it a particularly interesting case study of the mechanisms driving population change.
Statistics Sweden, the successor of the Tabellverket, publishes data on both deaths and births since recordkeeping began more than 250 years ago. These records suggest that around the year 1800, the Swedish death rate started falling, mainly due to improvements in health and living standards, especially for children.14 Yet while death rates were falling, birth rates remained at a constant pre-modern level until the 1860s. During this period and up until the first half of the 20th century, there was a sustained gap between the frequency of deaths and the frequency of births. It was because of this gap that the Swedish population increased. The following visualization supports these observations.
The Demographic Transition: Decline of the death rate followed by a decline ofthe birth rateBoth the birth and death rate are expressed per 1,000 of the population17491800185019001950201001020304050Sweden - Birth RateSweden - Death RateSource: Brian Mitchell - International Historical Statistics
Add country
Changes to birth and death rate over time around the world
The visualization presents the birth and death rate for all countries of the world over the last 5 decades. You can see the change over by moving the slider underneath back and forth or by pressing the "play" button. Countries per continent can also be highlighted by hovering and clicking on them in the legend on the right side of the chart.
By visualising this change we see how in country after country the death rate fell and the birth rate followed – countries moved to left-hand-side first and then fell to the bottom left corner.
Today, different countries straddle different stages of the model. Most developed countries have reached stage four and have low birth and death rates, while developing countries continue to make their way through the stages.
Birth rate vs Death rate, 2015Both the birth and death rate are given per 1,000 people of the country's population.Deaths per 1,0002468101214Births per 1,000010203040ChinaIndiaUnited StatesBrazilPakistanNigeriaBangladeshRussiaJapanVietnamEthiopiaEgyptGermanyIranDemocratic Republic of CongoThailandSouth AfricaTanzaniaMyanmarSouth KoreaSpainUkraineKenyaAlgeriaIraqSaudi ArabiaGhanaMadagascarCote d'IvoireCameroonAngolaBurkina FasoChileNigerCambodiaZimbabweBelgiumGuineaHaitiSerbiaUnited Arab EmiratesTajikistanJordanCentral African RepublicCroatiaCongoLebanonGeorgiaKuwaitJamaicaLesothoGambiaGabonBahrainCyprusFijiVanuatuGreenlandMonacoTimorPalestineAfricaAsiaEuropeNorth AmericaOceaniaSouth AmericaSource: World Bank – WDI
Search Average annual change
II.3 Fertility and population growth
All countries in the world have moved so far into the demographic transition that high mortality is now associated with higher rather than lower population growth. It is therefore the changing fertility that is determining what happens to population growth.
The below visualization shows the rate of fertility using data from the UN Population Division. Since the 1970s fertility rates in the less developed regions of the world are falling rapidly began to converge. As we see in the projection, the demographers from the UN predict this convergence to continue over the course of this century.
In the entry on fertility, we explain what is behind lower fertility rates — lower child mortality, higher incomes, the education of women, and the availability of contraception.
The total fertility rate by development level including the UN projectionsthrough 2100Total Fertility Rate is defined as the average number of children that would be born to a woman over her lifetime if the woman wereto experience the exact current age-specific fertility rates, and the woman were to survive from birth to the end of her reproductivelife.195019802000202020402060208020990123456Least developed countries - Mediumfertility variantLess developed regions - Mediumfertility variantWorld - Medium fertility variantMore developed regions - Mediumfertility variantSource: UN Population Division (2017 Revision)Note: More developed regions comprise Europe, Northern America, Australia/New Zealand and Japan; less developed regions comprise all regionsof Africa, Asia (excluding Japan), Latin America and the Caribbean plus Melanesia, Micronesia and Polynesia; least developed countries are 48countries, 33 in Africa, 9 in Asia, 5 in Oceania plus one in Latin America and the Caribbean.
Children per woman vs population growth, 2015The rate of natural population increase is the population increase determined by births and deaths. Migration flows arenot taken into account.Children per woman234567Annual Rate of Natural Population Increase0%1%2%3%ChinaIndiaUnited StatesPakistanNigeriaRussiaJapanPhilippinesVietnamEthiopiaIranDemocratic Republic of CongoThailandFranceSouth AfricaColombiaSpainUkraineKenyaAlgeriaIraqAfghanistanGhanaMozambiqueCote d'IvoireBurkina FasoNigerMalawiBelgiumSomaliaIsraelBulgariaTajikistanSierra LeoneKuwaitBelizeSamoaTongaNorthern AfricaAfricaAsiaEuropeNorth AmericaOceaniaSouth AmericaSource: UN Population Division (2017 Revision)
II.4 Child mortality and population growth
In the below visualization, we can see the observed correlation between population growth and child mortality across the world. Countries with high child mortality rates tend to have faster growing populations, while countries with low child mortality rates experience lower population growth rates.
Population growth rate vs Child mortality rate, 2015The child mortality rate measures the share of children that are born alive and die before they are five years old. Therate of natural population increase is determined by births and deaths only and migration flows are not taken intoaccount.Child mortality rate0%2%4%6%8%10%12% LINEARAnnual Rate of Natural Population Increase0%1%2%3%
ChinaIndiaUnited StatesIndonesiaPakistanNigeriaRussiaJapanPhilippinesEthiopiaEgyptIranTurkeyDemocratic Republic of CongoThailandSouth AfricaTanzaniaUkraineKenyaAlgeriaIraqAfghanistanMoroccoGhanaMozambiqueSyriaCote d'IvoireCameroonBurkina FasoNigerMaliMalawiSenegalChadSouth SudanBoliviaIsraelBulgariaTajikistanLaosSierra LeoneIrelandCongoPanamaOmanNamibiaGabonTrinidad and TobagoSwazilandDjiboutiReunionBruneiMayotteAsiaPalestineSerbia (including Kosovo)AfricaAsiaEuropeNorth AmericaOceaniaSouth AmericaSource: UN Population Division (2017 Revision)
1III. Data Quality & Measurement
III.1 Data on the population of the ancient world
Kremer (1993) provides estimates of the total world population over the last 1 million years.15 He puts together UN estimates for the period 1920-1990, as well as estimates from McEvedy and Jones (1978)16 for the period 10,000 BCE-1900 CE, and Deevey (1960)17 for the period 1,000,000 BCE-10,000 BCE.
The estimates from McEvedy and Jones (1978) after 200 BCE were obtained by aggregating population estimates for individual geographic regions taken from other authors (see references therein), and these in turn were based primarily on historical sources such as Roman and Chinese censuses. Their estimates of population prior to 200BCE were based on archaeological and anthropological evidence.
Many studies not considered in Kremer (1993) provide competing estimates of world population over long historical periods (Kremer (1993) mentions Clark (1977)18 and Durand (1977)19, but there are more). The following two graphs provide a sense of the dispersion of different estimates. All long-run estimates appear to be fairly close.
Comparison of different estimates of world population for the last million years - Figure 1 in DeLong (1998)20

Total World Population – Comparison of different sourcesThis chart compares estimates of the world population published by different sources.10000 BCE8000 BCE6000 BCE4000 BCE2000 BCE019700500 million1 billion1.5 billion2 billion2.5 billion3 billion3.5 billionTuve (1976)McEvedy and Jones (1978)Durand (1974), upperDurand (1974), lowerThomlinson (1975), upperSource: World Population over 12000 years - various sources (2016)
III.2 Data quality of recent world population estimates
The most discussed estimates of world population from the last century are those from the UN Population Division. These estimates are revised periodically and aim to be consistent and comparable within and across countries and time.
The methodology used by the UN to produce their estimates and projections is explained extensively in the World Population Prospects' Methodology Report.
In short, estimates of the population in the past (i.e. 1950-2015) are produced by starting with a base population for 1 July 1950 and computing subsequent populations based on the components that drive population change (fertility, mortality, and international migration). The estimates of these components are taken directly from national statistical sources or—where only partial or poor-quality data exists—are estimated by the Population Division staff. Population counts from periodic censuses are used as benchmarks. This calculation is called the "cohort-component" method because it estimates the change in population by age and sex (cohort) on the basis of the three afore-mentioned demographic components (component): fertility, mortality, and international migration.
The process of 'revising' the estimates involves incorporating new information about the demography of each country. The following diagram explains the process used to ensure consistency.
Process for generating UN population revisions – Table I.4. in the UN World Population Prospects Methodology Report21

One of the main implications of using the cohort-component method is that it sometimes leads to marked inconsistencies with official country statistics. The following map, which shows the coverage of births through civil registration, speaks to this issue: many countries, particularly those in the least developed regions of the world, have limited census data. For countries with no data in one or two decades before each revision, the UN derives estimates by extrapolating trends from countries in the same region with a socio-economic profile considered close to the country in question.
Completeness of birth registration, 2015Completeness of birth registration is the percentage of children under age 5 whose births were registered at the time ofthe survey. The numerator of completeness of birth registration includes children whose birth certificate was seen bythe interviewer or whose mother or caretaker says the birth has been registered.No data0%10%20%30%40%50%60%70%80%90%100%Source: World Bank –
For the completeness of death reporting, see here.
Uncertainty and data quality of related measures
The track record of projections of population growth is discussed in the entry on 'Future Population Growth' here.
IV. Data Sources
IV.1 Estimates of ancient population
As discussed in the previous section, there are a number of studies providing historic population data. The most commonly cited source is McEvedy and Jones (1978).
McEvedy and Jones (1978)
Data Source: McEvedy, Colin and Richard Jones (1978), "Atlas of World Population History," Facts on File, New York, pp. 342-351; relying on archeological and anthropological evidence, as well as historical documents such as Roman and Chinese censuses
Description of available measures: Population
Time span: 400BCE-2,000CE
Geographical coverage: Global by country and regions
This above source is an input used in producing the HYDE project data, as well as other datasets. Further references to this source are available in Goldewijk, K. K., Beusen, A., & Janssen, P. (2010). Long-term dynamic modelling of global population and built-up area in a spatially explicit way: HYDE 3.1. The Holocene.
History Database of the Global Environment (HYDE)
Data Source: History Database of the Global Environment project, using estimates from McEvedy and Jones (1978), Livi-Bacci (2007)22, Maddison (2001)23, and Denevan (1992)24
Description of available measures: Geographic distribution of the world population
Time span: 10,000BCE-2,000CE
Geographical coverage: Global at a 5 arc-minute spatial resolution
Link:http://themasites.pbl.nl/tridion/en/themasites/hyde/basicdrivingfactors/population/index-2.html
The data from the HYDE project is in turn the basis for the population series published by the 'Clio-Infra' project
Clio-Infra
Data Source: HYDE project and UN Population Division
Description of available measures: Population
Time span: 1,500-2,000CE
Geographical coverage: Global by country
Link: www.clio-infra.eu/
IV.2 Estimates of population in recent history and projections
UN Population Database
Data Source: UN Population Division based on 'cohort-component' framework by demographic trends (see Data Quality section)
Description of available measures:
◦ Population, by Five-Year Age Group and Sex
◦ Population Sex Ratio (males per 100 females)
◦ Median Age
◦ Population Growth Per Year
◦ Crude Birth Rate
◦ Crude Death Rate
◦ Net Reproduction Rate
◦ Total Fertility Rate
◦ Life Expectancy at Birth by Sex
◦ Net Migration Rate
◦ Sex ratio at birth
◦ Births
◦ Births by Age-group of Mother
◦ Age-specific Fertility Rates
◦ Women Aged 15-49
◦ Deaths by Sex
◦ Infant Mortality
◦ Mortality Under Age 5
◦ Dependency Ratios
◦ Population by Age: 0-4, 0-14, 5-14, 15-24, 15-59, 15-64, 60+, 65+, 80+
Time span: 1950-2015
Geographical coverage: Global by country
Link: http://esa.un.org/unpd/wpp/
Gridded Population of the World (GPW)
Data Source: Center for International Earth Science Information Network (CIESIN), published by the Socioeconomic Data and Applications Center (SDAC) based on census data
Description of available measures: Population
Time span: 1990-2010
Geographical coverage: Global at a 2.5 arc-minute spatial resolution
Link: http://sedac.ciesin.columbia.edu/data/collection/gpw-v3
Notes: Within the CIESIN, the Anthropogenic Biomes map the distribution of the world population at different points in time: 1700, 1800, 1900, 2000. These maps focus on the varying impact of humans on the environment.
LandScan
Data Publisher: University of Iowa (originally developed by the Oak Ridge National Laboratory (ORNL) for the Department of Defense, U.S.)
Data Source: Annual mid-year national population estimates from the Geographic Studies Branch, US Bureau of Census
Description of available measures: Population and 'ambient population' (a measure of person-hours accounting for varying presence throughout the day in commercial areas)
Time span: 1998-2012, but authors warn of inter-temporal comparability issues
Geographical coverage: Global at 30 arc-second grid spatial resolution (highest population resolution available)
Link: http://sedac.ciesin.columbia.edu/data/collection/gpw-v3
World Development Indicators
Data Publisher: World Bank
Data Source: UN Population Division
Description of available measures: Population growth (annual %)
Time span: 1981-2015
Geographical coverage: Global by country
Link: http://data.worldbank.org/indicator/
IV.3 Compilations of census data and other sources
Historical population data on a sub-national level – including their administrative divisions and principal towns – is collected by Jan Lahmeyer and published at his website www.populstat.info.
The Minnesota Population Center publishes various high-quality datasets based on census data beginning in 1790. At the time of writing this source was online at www.pop.umn.edu/index.php. It focuses on North America and Europe.
The Data & Information Services Center (DISC) Archive at University of Wisconsin-Madison provides access to census data and population datasets (mostly for the Americas). At the time of writing this source was online at http://www.disc.wisc.edu.
The International Database published by the U.S. Census Bureau provides data for the time 1950-2100. At the time of writing this source was online at https://www.census.gov/data-tools/demo/idb/informationGateway.php.
The Atlas of the Biosphere publishes data on Population Density. At the time of writing this source was online at www.sage.wisc.edu/atlas/maps.
Footnotes
As per estimates from Michael Kremer (1993) “Population Growth and Technological Change: One Million B.C. to 1990″, Quarterly Journal of Economics., August 1993, pp.681-716.
As per 2011 estimates from Carl Haub (2011), "How Many People Have Ever Lived on Earth?" Population Reference Bureau.
World population until 2015 – Our World In Data series (see below)
World population projection 2016 to 2100 is the UN Medium Variant from the 2015 revision published by the UN Population Division
As per 2011 estimates from Carl Haub (2011), "How Many People Have Ever Lived on Earth?" Population Reference Bureau.
See for example Kremer (1993) – Population growth and technological change: one million BC to 1990. In the Quarterly Journal of Economics, Vol. 108, No. 3, 681-716. Online here.
John Hawks, Keith Hunley, Sang-Hee Lee, Milford Wolpoff; Population Bottlenecks and Pleistocene Human Evolution, Molecular Biology and Evolution, Volume 17, Issue 1, 1 January 2000, Pages 2–22. Online here.
OurWorldInData annual world population series (based on HYDE and UN) until 2015. UN Medium Variant Projection after 2015 (2015 Revision)
OurWorldInData annual world population series (based on HYDE and UN) until 2015. UN Medium Variant Projection after 2015 (2015 Revision)
Data source: United Nations—World Population Prospects 2015
For more information on the "population dividend" see: http://www.unfpa.org/demographic-dividend
For a history and literature review of the theory's development, see: Kirk, Dudley. “Demographic transition theory.” Population studies 50.3 (1996): 361-387. Available online here
The data on birth rates, death rates and the total population is taken from the International Historical Statistics (IHS), edited by Palgrave Macmillan Ltd. (April 2013). The online version is available here. As a printed version it is published by Palgrave.
Wrigley, E. A., Schofield, R. S., & Schofield, R. (1989). The population history of England 1541-1871. Cambridge University Press.
Before 1800 more than 20% of Swedish babies died before they reached their first birthday, and of those who survived, another 20% died before their 10th birthday (see Croix, Lindh, and Malmberg (2009), Demographic change and economic growth in Sweden: 1750–2050. In Journal of Macroeconomics, 31, 1, 132--148).
Michael Kremer (1993) "Population Growth and Technological Change: One Million B.C. to 1990", Quarterly Journal of Economics., August 1993, pp.681-716.
McEvedy, Colin and Richard Jones (1978), "Atlas of World Population History," Facts on File, New York, pp. 342-351.
Deevey, Edward S. "The human population." Scientific American 203 (1960): 194-204.
Clark, Colin (1997). "Population growth and land use." London: Macmillan.
Durand, John D. (1974), "Historical Estimates of World Population: An Evaluation," Population and Development Review III, 253-96.
J. Bradford DeLong (1998) "Estimating World GDP, One Million B.C. - Present".
UN World Population Prospects Methodology Report
Livi-Bacci (2007), "A Concise History of World Population". Oxford: Blackwell Publishing.
Maddison, A. (2001). The World Economy: A Millennial Perspective, Development Centre of the Organization for Economic Cooperation and Development.
Denevan, W. M. (1992). The pristine myth: the landscape of the Americas in 1492. Annals of the Association of American Geographers, 82(3), 369-385.
www.fotavgeia.blogspot.com
Δεν υπάρχουν σχόλια:
Δημοσίευση σχολίου