
Commodities
New crude oil trend is range trading, but with positive carry
Bloomberg Intelligence September 04, 2018
This analysis is by Bloomberg Intelligence analyst Mike McGlone. It appeared first on the Bloomberg Terminal.
Access the full Bloomberg Commodity Outlook – September 2018 Edition
Petroleum prices and indexes are likely transitioning to positive roll yields from strong spot returns. Prices have returned to the mean from the financial-crisis trough to peak, with primary bull-market companions historically extended. Levels of backwardation, demand vs. supply and stocks-to-use aren’t supportive of sustained higher prices. Momentum remains up though, and the new dynamic for investors is positive carry for the first time on an annual basis since 2014. A geopolitical event is likely necessary for WTI to reach $80 a barrel.
A normal 20% correction gets to near $60. Natural gas is the wild card. Typically the most volatile commodity, it has been caged within the narrowest range in futures history (dating to 1989). Primary companions are pointing positive, including the backwardated one-year futures curve.
The crude oil bull — Transitioning to extended range trade
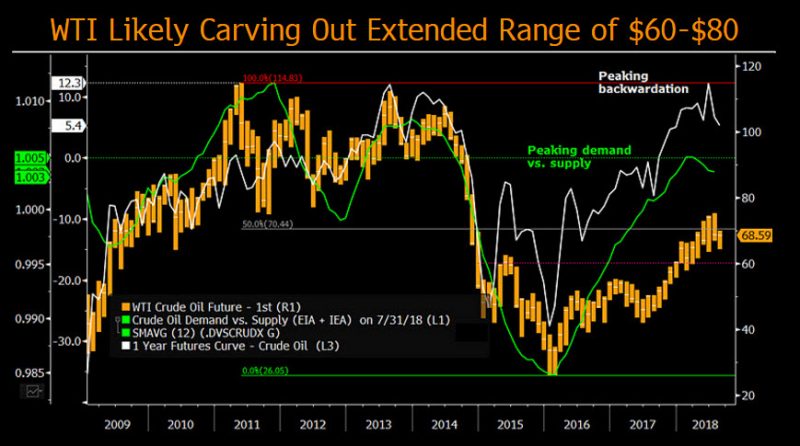
With its primary bull-market companions extended and prices back near the most neutral zone of the past decade, crude oil is likely now in an extended range trade. The majority of the bell curve is likely $60-$80 a barrel for WTI.
Primary crude oil bull companions peaking
The majority of this crude oil rally is likely over with the market now carving out a range. Indicating peaking prices, favorable trends in primary bull-market companions — the one-year futures curve and demand exceeding supply — have reached good resistance. So have prices. WTI crude oil near $70 a barrel is the median price from the 2011 peak to the 2016 low. A $60-$80 range makes sense, with some form of geopolitical event likely necessary to reach the upper end.
A normal 20% correction from the 2018 peak of $75.27 would achieve the lower end of the range. In 2017, the peak-to-trough correction was 23.9%. Copper has matched that this year, which makes it the more likely commodity to recover. Crude oil has corrected 14% since the 2018 high.
Crude oil spot gains leading most commodities
Indicating overall energy-sector improvement, the Bloomberg Energy Subindex Total Return exceeds the spot change by about a percentage point in 2018 through Aug. 28, making it the first year for positive roll yields since 2014. Spot changes have been the primary driver of positive returns, but are transitioning to positive carry from rolling into backwardation. Brent and WTI remain the biggest drivers of overall commodity-index positive returns, increasing almost 20% on the back of slight gains in August.
Lower natural gas prices represent the only drag in the energy index this year. Caged within the narrowest range in futures history on an annual basis, natural gas leads commodities with the most potential upside breakout potential. Typically the highest-volatility commodity, gas drivers are turning favorably.
Bloomberg Commodity OutlookGet analysis and data delivered monthly to your inbox
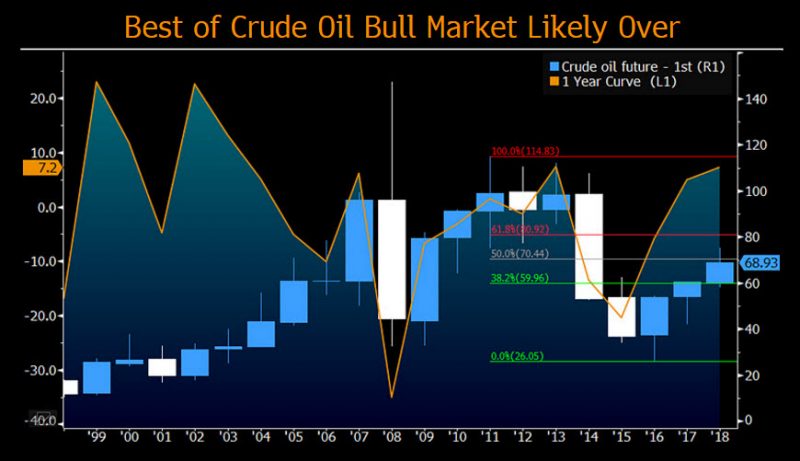
Extended bull — $60-$80 WTI crude oil range
The best of the WTI crude oil bull run is likely over. An extended range trade of $60-$80 a barrel should mark the majority of the bell curve. There’s limited running room left in primary bull-market drivers including the backward-trending futures curve, declining inventories and demand in excess of supply. U.S. production should continue to exceed most estimates, while the bigger picture of rapidly advancing technology is reducing demand growth and accelerating supply. Energy is the sector most susceptible to shifting global demographic paradigms.
Last year, $60.51 was the high for crude, and $79.28 was the average low from 2011-13. A sustained bid arising from geopolitical tensions is needed to keep crude much above the $70.44 halfway mark of the 2011-16 bear market. Backwardation should continue to boost total returns.
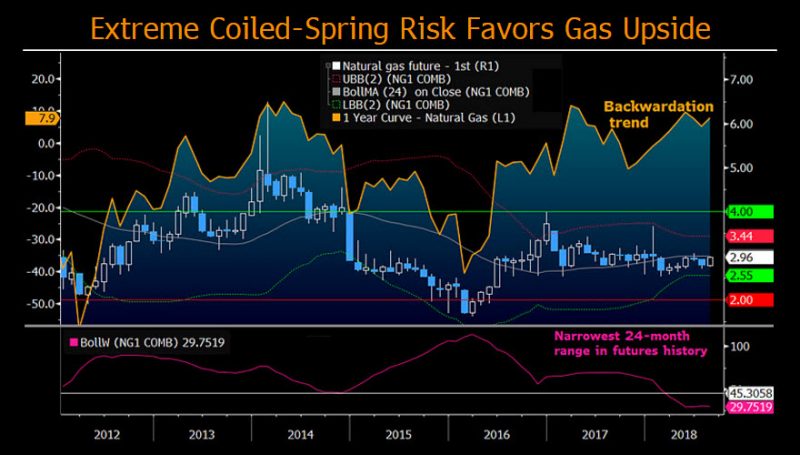
Natural-gas rally likely a matter of time; High explosion risk
The technical outlook for the U.S. traded natural-gas futures benchmark favors higher prices. Extreme price compression for an extended period elevates the chances of a sharp rally. The persistent trend deeper into backwardation in the one-year futures curve is a bullish indicator.
Gas upside potential outweighs downside risks
Stuck within an increasingly compressed range and with primary companions trending favorably, the potential for a sharp natural-gas rally outweighs decline risks. Simply put, the most widely traded natural-gas benchmark future is more likely to break out of its cage to almost $4 MMBtu, not $2. Stuck within that range for about three years has coincided with a distinct trend toward backwardation in the one-year futures curve. An oxymoron in natural gas, front futures trading above the backs is an indication of demand exceeding supply.
Seasonality is a prime factor in natural gas, which is primarily used for winter heating, but the one-year curve eliminates it.
Access the full Bloomberg Commodity Outlook – September 2018 Edition
www.fotavgeia.blogspot.com
New crude oil trend is range trading, but with positive carry
Bloomberg Intelligence September 04, 2018
This analysis is by Bloomberg Intelligence analyst Mike McGlone. It appeared first on the Bloomberg Terminal.
Access the full Bloomberg Commodity Outlook – September 2018 Edition
Petroleum prices and indexes are likely transitioning to positive roll yields from strong spot returns. Prices have returned to the mean from the financial-crisis trough to peak, with primary bull-market companions historically extended. Levels of backwardation, demand vs. supply and stocks-to-use aren’t supportive of sustained higher prices. Momentum remains up though, and the new dynamic for investors is positive carry for the first time on an annual basis since 2014. A geopolitical event is likely necessary for WTI to reach $80 a barrel.
A normal 20% correction gets to near $60. Natural gas is the wild card. Typically the most volatile commodity, it has been caged within the narrowest range in futures history (dating to 1989). Primary companions are pointing positive, including the backwardated one-year futures curve.
The crude oil bull — Transitioning to extended range trade
With its primary bull-market companions extended and prices back near the most neutral zone of the past decade, crude oil is likely now in an extended range trade. The majority of the bell curve is likely $60-$80 a barrel for WTI.
Primary crude oil bull companions peaking
The majority of this crude oil rally is likely over with the market now carving out a range. Indicating peaking prices, favorable trends in primary bull-market companions — the one-year futures curve and demand exceeding supply — have reached good resistance. So have prices. WTI crude oil near $70 a barrel is the median price from the 2011 peak to the 2016 low. A $60-$80 range makes sense, with some form of geopolitical event likely necessary to reach the upper end.
A normal 20% correction from the 2018 peak of $75.27 would achieve the lower end of the range. In 2017, the peak-to-trough correction was 23.9%. Copper has matched that this year, which makes it the more likely commodity to recover. Crude oil has corrected 14% since the 2018 high.
Crude oil spot gains leading most commodities
Indicating overall energy-sector improvement, the Bloomberg Energy Subindex Total Return exceeds the spot change by about a percentage point in 2018 through Aug. 28, making it the first year for positive roll yields since 2014. Spot changes have been the primary driver of positive returns, but are transitioning to positive carry from rolling into backwardation. Brent and WTI remain the biggest drivers of overall commodity-index positive returns, increasing almost 20% on the back of slight gains in August.
Lower natural gas prices represent the only drag in the energy index this year. Caged within the narrowest range in futures history on an annual basis, natural gas leads commodities with the most potential upside breakout potential. Typically the highest-volatility commodity, gas drivers are turning favorably.
Bloomberg Commodity OutlookGet analysis and data delivered monthly to your inbox
Extended bull — $60-$80 WTI crude oil range
The best of the WTI crude oil bull run is likely over. An extended range trade of $60-$80 a barrel should mark the majority of the bell curve. There’s limited running room left in primary bull-market drivers including the backward-trending futures curve, declining inventories and demand in excess of supply. U.S. production should continue to exceed most estimates, while the bigger picture of rapidly advancing technology is reducing demand growth and accelerating supply. Energy is the sector most susceptible to shifting global demographic paradigms.
Last year, $60.51 was the high for crude, and $79.28 was the average low from 2011-13. A sustained bid arising from geopolitical tensions is needed to keep crude much above the $70.44 halfway mark of the 2011-16 bear market. Backwardation should continue to boost total returns.
Natural-gas rally likely a matter of time; High explosion risk
The technical outlook for the U.S. traded natural-gas futures benchmark favors higher prices. Extreme price compression for an extended period elevates the chances of a sharp rally. The persistent trend deeper into backwardation in the one-year futures curve is a bullish indicator.
Gas upside potential outweighs downside risks
Stuck within an increasingly compressed range and with primary companions trending favorably, the potential for a sharp natural-gas rally outweighs decline risks. Simply put, the most widely traded natural-gas benchmark future is more likely to break out of its cage to almost $4 MMBtu, not $2. Stuck within that range for about three years has coincided with a distinct trend toward backwardation in the one-year futures curve. An oxymoron in natural gas, front futures trading above the backs is an indication of demand exceeding supply.
Seasonality is a prime factor in natural gas, which is primarily used for winter heating, but the one-year curve eliminates it.
Access the full Bloomberg Commodity Outlook – September 2018 Edition
www.fotavgeia.blogspot.com
Δεν υπάρχουν σχόλια:
Δημοσίευση σχολίου